|
Luton South
Labour hold

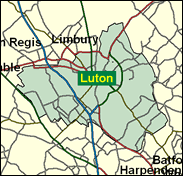
The announcement of the total closure of the once mighty source of employment and recognition, Vauxhall Motors, in December 2000 will do nothing for the economy or self-esteem of the proud town of Luton, which is looking more and more like a Labour stronghold. They should retain both parliamentary seats easily. Luton South includes the site of the car works, visible to many as they proceed, car- or coach-bound, to a healthier face of Luton's future, its airport famed as a launchpad for sorties in search of the sun. Also in the seat is a substantial chunk of the old hatting town's workmanlike centre, with its university which has been known to come plumb last in the league tables of the 130 or so such institutions now to be found in the UK; and part of Luton's large non-white (mainly Asian) ethnic minority population. All in all, Luton South does not appear to be a strong candidate for a sweeping and dramatic return by William Hague's party in June 2001.

Margaret Moran, gor-blimey-accented, and sorter-out of the hard left as leader of Lewisham Council, won this seat in 1997 after selection from an all-women shortlist. The daughter of Irish immigrants, she was born in 1955 and educated at St Ursula’s Convent School, Greenwich, St Mary’s (RC) College of Education, Twickenham, and Birmingham University. She formerly ran a ‘Housing for Women’ housing association. Locally-focused in a traditionally marginal seat, she has been a PPS since December 1997, currently to Mo Mowlam, and favours computer-based ‘teledemocracy’ to up electoral participation rates among women and ethnic minorities. She also worries about disease, domestic violence and bad housing in her local Asian community.
 |
| Wealthy Achievers, Suburban Areas |
2.81% |
14.99% |
18.77 |
|
| Affluent Greys, Rural Communities |
0.26% |
2.13% |
12.14 |
|
| Prosperous Pensioners, Retirement Areas |
0.44% |
2.49% |
17.58 |
|
| Affluent Executives, Family Areas |
6.43% |
4.43% |
145.37 |
|
| Well-Off Workers, Family Areas |
11.08% |
7.27% |
152.28 |
|
| Affluent Urbanites, Town & City Areas |
4.24% |
2.56% |
165.33 |
|
| Prosperous Professionals, Metropolitan Areas |
0.00% |
2.04% |
0.00 |
|
| Better-Off Executives, Inner City Areas |
2.21% |
3.94% |
55.93 |
|
| Comfortable Middle Agers, Mature Home Owning Areas |
8.23% |
13.04% |
63.10 |
|
| Skilled Workers, Home Owning Areas |
23.83% |
12.70% |
187.57 |
|
| New Home Owners, Mature Communities |
5.01% |
8.14% |
61.51 |
|
| White Collar Workers, Better-Off Multi Ethnic Areas |
2.47% |
4.02% |
61.40 |
|
| Older People, Less Prosperous Areas |
3.27% |
3.19% |
102.56 |
|
| Council Estate Residents, Better-Off Homes |
15.06% |
11.31% |
133.13 |
|
| Council Estate Residents, High Unemployment |
2.19% |
3.06% |
71.47 |
|
| Council Estate Residents, Greatest Hardship |
1.27% |
2.52% |
50.57 |
|
| People in Multi-Ethnic, Low-Income Areas |
11.21% |
2.10% |
533.73 |
|
| Unclassified |
0.01% |
0.06% |
13.04 |
|
|
 |
|
|
| £0-5K |
9.00% |
9.41% |
95.64 |
|
| £5-10K |
15.93% |
16.63% |
95.80 |
|
| £10-15K |
16.54% |
16.58% |
99.77 |
|
| £15-20K |
14.02% |
13.58% |
103.24 |
|
| £20-25K |
10.96% |
10.39% |
105.50 |
|
| £25-30K |
8.28% |
7.77% |
106.53 |
|
| £30-35K |
6.17% |
5.79% |
106.49 |
|
| £35-40K |
4.58% |
4.33% |
105.64 |
|
| £40-45K |
3.40% |
3.27% |
104.18 |
|
| £45-50K |
2.54% |
2.48% |
102.30 |
|
| £50-55K |
1.91% |
1.90% |
100.16 |
|
| £55-60K |
1.44% |
1.47% |
97.87 |
|
| £60-65K |
1.10% |
1.15% |
95.50 |
|
| £65-70K |
0.84% |
0.91% |
93.12 |
|
| £70-75K |
0.65% |
0.72% |
90.78 |
|
| £75-80K |
0.51% |
0.57% |
88.49 |
|
| £80-85K |
0.40% |
0.46% |
86.28 |
|
| £85-90K |
0.32% |
0.37% |
84.16 |
|
| £90-95K |
0.25% |
0.31% |
82.13 |
|
| £95-100K |
0.20% |
0.25% |
80.20 |
|
| £100K + |
0.95% |
1.34% |
70.33 |
|
|
|
|


|
1992-1997
|
1997-2001
|
|
|
|
| Con |
-12.94% |
| Lab |
11.65% |
| LD |
-1.63% |
|
| Con |
-1.83% |
| Lab |
0.50% |
| LD |
1.37% |
|
|
|
Margaret Moran
Labour hold
|
| Con |
 |
11,586 |
29.52% |
| Lab |
 |
21,719 |
55.34% |
| LD |
 |
4,292 |
10.94% |
| Oth |
 |
1,647 |
4.20% |
| Maj |
 |
10,133 |
25.82% |
| Turn |
|
39,244 |
56.89% |
|
|
|
Margaret Moran
Labour hold
|
| WRP |
Robert Bolton |
271 |
0.69% |
| C |
Gordon Henderson |
11,586 |
29.52% |
| UK |
Charles Lawman |
578 |
1.47% |
| LD |
Rabi Martins |
4,292 |
10.94% |
| L |
Margaret Moran |
21,719 |
55.34% |
| G |
Marc Scheimann |
798 |
2.03% |
|
Candidates representing 6 parties stood for election to this seat.
|
|
|
Margaret Moran
Labour gain
|
| Con |
|
15,109 |
31.36% |
| Lab |
|
26,428 |
54.85% |
| LD |
|
4,610 |
9.57% |
| Ref |
 |
1,205 |
2.50% |
| Oth |
|
832 |
1.73% |
| Maj |
|
11,319 |
23.49% |
| Turn |
|
48,184 |
70.45% |
|
|
|
|
Conservative
|
| Con |
|
22,928 |
44.30% |
| Lab |
|
22,396 |
43.20% |
| LD |
|
5,795 |
11.20% |
| Oth |
|
676 |
1.30% |
| Maj |
|
532 |
1.00% |
| Turn |
|
51,795 |
78.45% |
|
|
|
|
|