|
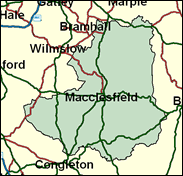
Macclesfield
Conservative hold

The distinctive contributions of Nicholas Winterton, a maverick backbencher since his election to the House thirty years ago, would surely have been missed in the extremely unlikely event that he had been elected Speaker in October 2000. He has never had any trouble in retaining the east Cheshire seat he won narrowly at a time of unpopular Tory government in 1971, and his share declined by well under the average in 1997, not least because he was not opposed by any anti-European candidates. He obtained very nearly 50pc of the vote, very rare for a Conservative in a year when the party struggled to pass 30pc nationally. No doubt he will continue to entertain all and sundry in the next Parliament too.

Nicholas Winterton, first elected here in 1971, will after the election be the fourth longest-serving Conservative MP, outdistanced only by Sir Peter Tapsell, Sir Patrick Cormack and Kenneth Clarke. Unlike them he has never reached the front bench, and in trying to reach the Speaker’s chair in 2000 polled only 116 votes. Non-knighted because loathed by the Whips, to himself he is “a man of independent view”. To some a man of integrity, to others a shallow populist. Born 1938 and educated at Rugby, he worked for 20 years for his father-in-law’s plant hire firm. Pink-faced, pugnacious, opinionated and fog-horn-voiced, he is Eurosceptic and homophobic, but not an orthodox free-market Tory. He favours import controls to protect British manufacturing, and opposed Heseltine’s pit closures. He backs the Turks in Cyprus.
 |
| Wealthy Achievers, Suburban Areas |
31.70% |
14.99% |
211.44 |
|
| Affluent Greys, Rural Communities |
0.39% |
2.13% |
18.57 |
|
| Prosperous Pensioners, Retirement Areas |
1.15% |
2.49% |
46.39 |
|
| Affluent Executives, Family Areas |
12.65% |
4.43% |
285.78 |
|
| Well-Off Workers, Family Areas |
9.87% |
7.27% |
135.70 |
|
| Affluent Urbanites, Town & City Areas |
0.92% |
2.56% |
35.75 |
|
| Prosperous Professionals, Metropolitan Areas |
0.00% |
2.04% |
0.00 |
|
| Better-Off Executives, Inner City Areas |
0.01% |
3.94% |
0.30 |
|
| Comfortable Middle Agers, Mature Home Owning Areas |
11.94% |
13.04% |
91.55 |
|
| Skilled Workers, Home Owning Areas |
9.43% |
12.70% |
74.20 |
|
| New Home Owners, Mature Communities |
7.09% |
8.14% |
87.01 |
|
| White Collar Workers, Better-Off Multi Ethnic Areas |
3.79% |
4.02% |
94.35 |
|
| Older People, Less Prosperous Areas |
3.38% |
3.19% |
106.00 |
|
| Council Estate Residents, Better-Off Homes |
5.96% |
11.31% |
52.68 |
|
| Council Estate Residents, High Unemployment |
1.46% |
3.06% |
47.66 |
|
| Council Estate Residents, Greatest Hardship |
0.27% |
2.52% |
10.56 |
|
| People in Multi-Ethnic, Low-Income Areas |
0.00% |
2.10% |
0.00 |
|
| Unclassified |
0.00% |
0.06% |
0.00 |
|
|
 |
 |
 |
| £0-5K |
5.66% |
9.41% |
60.08 |
|
| £5-10K |
11.79% |
16.63% |
70.87 |
|
| £10-15K |
13.78% |
16.58% |
83.13 |
|
| £15-20K |
12.91% |
13.58% |
95.06 |
|
| £20-25K |
11.01% |
10.39% |
105.91 |
|
| £25-30K |
8.98% |
7.77% |
115.49 |
|
| £30-35K |
7.17% |
5.79% |
123.83 |
|
| £35-40K |
5.68% |
4.33% |
131.03 |
|
| £40-45K |
4.48% |
3.27% |
137.22 |
|
| £45-50K |
3.54% |
2.48% |
142.53 |
|
| £50-55K |
2.80% |
1.90% |
147.08 |
|
| £55-60K |
2.23% |
1.47% |
150.97 |
|
| £60-65K |
1.78% |
1.15% |
154.31 |
|
| £65-70K |
1.42% |
0.91% |
157.16 |
|
| £70-75K |
1.15% |
0.72% |
159.61 |
|
| £75-80K |
0.93% |
0.57% |
161.71 |
|
| £80-85K |
0.76% |
0.46% |
163.50 |
|
| £85-90K |
0.62% |
0.37% |
165.03 |
|
| £90-95K |
0.51% |
0.31% |
166.33 |
|
| £95-100K |
0.42% |
0.25% |
167.44 |
|
| £100K + |
2.29% |
1.34% |
170.12 |
|
|
|

|


|
1992-1997
|
1997-2001
|
|
|
|
| Con |
-6.39% |
| Lab |
10.74% |
| LD |
-3.96% |
|
| Con |
-0.73% |
| Lab |
-0.55% |
| LD |
1.28% |
|
|
 |
Nicholas Winterton
Conservative hold
|
| Con |
 |
22,284 |
48.88% |
| Lab |
 |
15,084 |
33.09% |
| LD |
 |
8,217 |
18.03% |
| Oth |
|
0 |
0.00% |
| Maj |
 |
7,200 |
15.79% |
| Turn |
 |
45,585 |
62.34% |
|
|
 |
Nicholas Winterton
Conservative hold
|
| L |
Stephen Carter |
15,084 |
33.09% |
| LD |
Mike Flynn |
8,217 |
18.03% |
| C |
Nicholas Winterton |
22,284 |
48.88% |
|
Candidates representing 3 parties stood for election to this seat.
|
|
 |
Nicholas Winterton
Conservative
|
| Con |
 |
26,888 |
49.61% |
| Lab |
 |
18,234 |
33.64% |
| LD |
 |
9,075 |
16.74% |
| Ref |
|
0 |
0.00% |
| Oth |
|
0 |
0.00% |
| Maj |
 |
8,654 |
15.97% |
| Turn |
 |
54,197 |
75.22% |
|
|
 |
|
Conservative
|
| Con |
 |
32,332 |
56.00% |
| Lab |
 |
13,202 |
22.90% |
| LD |
 |
11,958 |
20.70% |
| Oth |
 |
246 |
0.40% |
| Maj |
 |
19,130 |
33.10% |
| Turn |
 |
57,738 |
81.51% |
|
|
 |
|

|

