|
Maidenhead
Conservative hold

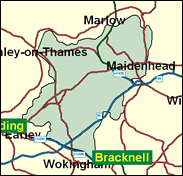
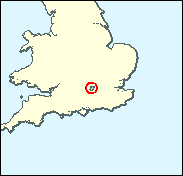
The floods which increasingly affect Britain strike alike at poor and affluent areas, and there could scarcely be a more well-heeled area than Maidenhead, which borders the Thames for some miles in the Royal County of Berkshire, taking in Cookham, Charvil, Sonning and Twyford and reaching west almost as far as the Reading suburbs. This is a predominantly Conservative area despite a substantial Liberal Democrat presence, particularly in Maidenhead town, where they won over a dozen local council seats in the unitary council elections which took place on the same day and therefore with the same turnout as the 1997 General Election. Yet at parliamentary level it was John Major's party which was favoured then, as the LD percentage declined and the Conservative Theresa May won by nearly 12,000, a sumptuous result in so dismal a year for her party.

Theresa May, though only elected in 1997, was quickly on to the front bench and even into the Shadow Cabinet as Education spokesman, because of the very low female numbers on the Conservative benches. A former banker who adapted quickly to the Commons as a combative and fluent performer, she was born 1956 and educated at Wheatley Park Comprehensive School, Oxfordshire, and St. Hugh’s College, Oxford. As Tory spokesman on women’s issues she opposed Health spokesman Liam Fox’s call in January 2001 for a “huge restriction, if not abolition” of the current abortion law.
 |
| Wealthy Achievers, Suburban Areas |
50.36% |
14.99% |
335.91 |
|
| Affluent Greys, Rural Communities |
0.00% |
2.13% |
0.00 |
|
| Prosperous Pensioners, Retirement Areas |
2.14% |
2.49% |
86.27 |
|
| Affluent Executives, Family Areas |
8.13% |
4.43% |
183.65 |
|
| Well-Off Workers, Family Areas |
9.71% |
7.27% |
133.56 |
|
| Affluent Urbanites, Town & City Areas |
2.41% |
2.56% |
94.13 |
|
| Prosperous Professionals, Metropolitan Areas |
2.54% |
2.04% |
124.29 |
|
| Better-Off Executives, Inner City Areas |
0.68% |
3.94% |
17.24 |
|
| Comfortable Middle Agers, Mature Home Owning Areas |
8.85% |
13.04% |
67.89 |
|
| Skilled Workers, Home Owning Areas |
1.52% |
12.70% |
11.93 |
|
| New Home Owners, Mature Communities |
5.88% |
8.14% |
72.20 |
|
| White Collar Workers, Better-Off Multi Ethnic Areas |
3.20% |
4.02% |
79.56 |
|
| Older People, Less Prosperous Areas |
1.47% |
3.19% |
46.03 |
|
| Council Estate Residents, Better-Off Homes |
1.99% |
11.31% |
17.56 |
|
| Council Estate Residents, High Unemployment |
0.02% |
3.06% |
0.77 |
|
| Council Estate Residents, Greatest Hardship |
0.00% |
2.52% |
0.00 |
|
| People in Multi-Ethnic, Low-Income Areas |
1.09% |
2.10% |
51.76 |
|
| Unclassified |
0.01% |
0.06% |
13.82 |
|
|
 |
|
|
| £0-5K |
3.62% |
9.41% |
38.44 |
|
| £5-10K |
7.93% |
16.63% |
47.65 |
|
| £10-15K |
10.34% |
16.58% |
62.38 |
|
| £15-20K |
10.82% |
13.58% |
79.64 |
|
| £20-25K |
10.18% |
10.39% |
97.98 |
|
| £25-30K |
9.06% |
7.77% |
116.53 |
|
| £30-35K |
7.80% |
5.79% |
134.75 |
|
| £35-40K |
6.60% |
4.33% |
152.33 |
|
| £40-45K |
5.52% |
3.27% |
169.08 |
|
| £45-50K |
4.59% |
2.48% |
184.91 |
|
| £50-55K |
3.80% |
1.90% |
199.79 |
|
| £55-60K |
3.15% |
1.47% |
213.74 |
|
| £60-65K |
2.61% |
1.15% |
226.78 |
|
| £65-70K |
2.17% |
0.91% |
238.97 |
|
| £70-75K |
1.80% |
0.72% |
250.36 |
|
| £75-80K |
1.50% |
0.57% |
261.00 |
|
| £80-85K |
1.25% |
0.46% |
270.94 |
|
| £85-90K |
1.05% |
0.37% |
280.25 |
|
| £90-95K |
0.88% |
0.31% |
288.96 |
|
| £95-100K |
0.74% |
0.25% |
297.13 |
|
| £100K + |
4.55% |
1.34% |
338.62 |
|
|
|
|


|
1992-1997
|
1997-2001
|
|
|
|
| Con |
-11.80% |
| Lab |
9.49% |
| LD |
-3.54% |
|
| Con |
-4.77% |
| Lab |
-2.91% |
| LD |
11.19% |
|
|
|
Theresa May
Conservative hold
|
| Con |
 |
19,506 |
45.03% |
| Lab |
 |
6,577 |
15.18% |
| LD |
 |
16,222 |
37.45% |
| Oth |
 |
1,013 |
2.34% |
| Maj |
 |
3,284 |
7.58% |
| Turn |
|
43,318 |
63.58% |
|
|
|
Theresa May
Conservative hold
|
| ML |
Lloyd Clarke |
272 |
0.63% |
| UK |
Denis Cooper |
741 |
1.71% |
| C |
Theresa May |
19,506 |
45.03% |
| LD |
Kathryn Newbound |
16,222 |
37.45% |
| L |
John O'Farrell |
6,577 |
15.18% |
|
Candidates representing 5 parties stood for election to this seat.
|
|
|
Theresa May
Conservative
|
| Con |
|
25,344 |
49.80% |
| Lab |
|
9,205 |
18.09% |
| LD |
|
13,363 |
26.26% |
| Ref |
 |
1,638 |
3.22% |
| Oth |
|
1,339 |
2.63% |
| Maj |
|
11,981 |
23.54% |
| Turn |
|
50,889 |
75.61% |
|
|
|
|
Conservative
|
| Con |
|
33,958 |
61.60% |
| Lab |
|
4,741 |
8.60% |
| LD |
|
16,462 |
29.80% |
| Oth |
|
0 |
0.00% |
| Maj |
|
17,496 |
31.70% |
| Turn |
|
55,161 |
83.50% |
|
|
|
|
|