|
Maidstone & The Weald
Conservative hold

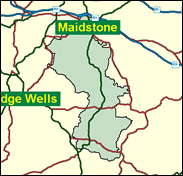
The redoubtable Shadow Home Secretary, one of the most distinctive of present-day politicians, Ann Widdecombe, holds a safe seat in Maidstone and the Weald. Her victory is more comfortable than might at first be expected, for the county town itself contains a substantial Labour inclined council estate bloc at Shepway and Park Wood in south east Maidstone, and has a history of Liberal Democrat activism and municipal success too. Yet a number of factors helped her in 1997. The working class segment was taken out of this seat and placed in the ragbag called Faversham and Mid Kent. The Liberal Democrats failed to convert their council success into parliamentary votes and slipped to third place. Finally, a very Conservative rural section (actually just part of the Weald, to go along with just part of Maidstone, to make the title of the seat less than wholly accurate) was added, including such places as Sissinghurst with its castle and gardens; the attractive towns of Cranbrook and Hawkhurst; and Benenden, the elite girls school which numbers Princess Anne among its former pupils. In the local elections which took place on 4 May 2000, Ann Widdecombe's seat included, in Maidstone Borough, the ward with the highest Conservative percentage of any contested in Britain: 90.6pc, against both Labour and Liberal Democrat opposition. Its name? Barming.

Ann Widdecombe, Shadow Home Secretary and MP here since 1987, though trailed as a potential Tory leader, would present serious difficulties for the marketing men as an untelegenic, shrill-voiced, churchy spinster, who has described TV as “filth”. Born 1947 and educated at a convent in Bath and at Birmingham University and Lady Margaret Hall, Oxford, she worked previously as a university administrator. Her political breakthrough from joke to heroine came with her rubbishing of the unpopular Michael Howard whose leadership hopes she effectively crushed. She left Canterbury for Rome over female ordination and prompted eight fellow Shadow Cabinet members to admit their dope-sodden pasts in order to scotch her emotive call for on-the-spot fines for cannabis possession. She is in the tiny Tory minority against fox-hunting.
 |
| Wealthy Achievers, Suburban Areas |
31.04% |
14.99% |
207.02 |
|
| Affluent Greys, Rural Communities |
0.63% |
2.13% |
29.57 |
|
| Prosperous Pensioners, Retirement Areas |
0.94% |
2.49% |
37.62 |
|
| Affluent Executives, Family Areas |
2.91% |
4.43% |
65.85 |
|
| Well-Off Workers, Family Areas |
11.41% |
7.27% |
156.81 |
|
| Affluent Urbanites, Town & City Areas |
0.95% |
2.56% |
37.19 |
|
| Prosperous Professionals, Metropolitan Areas |
0.02% |
2.04% |
1.15 |
|
| Better-Off Executives, Inner City Areas |
2.71% |
3.94% |
68.83 |
|
| Comfortable Middle Agers, Mature Home Owning Areas |
21.17% |
13.04% |
162.39 |
|
| Skilled Workers, Home Owning Areas |
10.99% |
12.70% |
86.55 |
|
| New Home Owners, Mature Communities |
4.36% |
8.14% |
53.52 |
|
| White Collar Workers, Better-Off Multi Ethnic Areas |
7.30% |
4.02% |
181.46 |
|
| Older People, Less Prosperous Areas |
2.56% |
3.19% |
80.51 |
|
| Council Estate Residents, Better-Off Homes |
1.18% |
11.31% |
10.42 |
|
| Council Estate Residents, High Unemployment |
0.26% |
3.06% |
8.55 |
|
| Council Estate Residents, Greatest Hardship |
1.44% |
2.52% |
57.33 |
|
| People in Multi-Ethnic, Low-Income Areas |
0.00% |
2.10% |
0.00 |
|
| Unclassified |
0.11% |
0.06% |
178.16 |
|
|
 |
 |
 |
| £0-5K |
6.55% |
9.41% |
69.63 |
|
| £5-10K |
13.11% |
16.63% |
78.80 |
|
| £10-15K |
14.89% |
16.58% |
89.79 |
|
| £15-20K |
13.52% |
13.58% |
99.56 |
|
| £20-25K |
11.18% |
10.39% |
107.57 |
|
| £25-30K |
8.86% |
7.77% |
113.91 |
|
| £30-35K |
6.88% |
5.79% |
118.83 |
|
| £35-40K |
5.31% |
4.33% |
122.60 |
|
| £40-45K |
4.10% |
3.27% |
125.46 |
|
| £45-50K |
3.17% |
2.48% |
127.61 |
|
| £50-55K |
2.46% |
1.90% |
129.22 |
|
| £55-60K |
1.92% |
1.47% |
130.39 |
|
| £60-65K |
1.51% |
1.15% |
131.23 |
|
| £65-70K |
1.19% |
0.91% |
131.82 |
|
| £70-75K |
0.95% |
0.72% |
132.21 |
|
| £75-80K |
0.76% |
0.57% |
132.45 |
|
| £80-85K |
0.61% |
0.46% |
132.58 |
|
| £85-90K |
0.50% |
0.37% |
132.61 |
|
| £90-95K |
0.40% |
0.31% |
132.57 |
|
| £95-100K |
0.33% |
0.25% |
132.49 |
|
| £100K + |
1.76% |
1.34% |
131.30 |
|
|
|

|


|
1992-1997
|
1997-2001
|
|
|
|
| Con |
-11.97% |
| Lab |
13.72% |
| LD |
-7.94% |
|
| Con |
5.50% |
| Lab |
0.78% |
| LD |
-2.47% |
|
|
 |
Ann Widdecombe
Conservative hold
|
| Con |
 |
22,621 |
49.63% |
| Lab |
 |
12,303 |
26.99% |
| LD |
 |
9,064 |
19.89% |
| Oth |
 |
1,589 |
3.49% |
| Maj |
 |
10,318 |
22.64% |
| Turn |
 |
45,577 |
61.59% |
|
|
 |
Ann Widdecombe
Conservative hold
|
| UK |
John Botting |
978 |
2.15% |
| L |
Mark Davis |
12,303 |
26.99% |
| I |
Neil Hunt |
611 |
1.34% |
| LD |
Allison Wainman |
9,064 |
19.89% |
| C |
Ann Widdecombe |
22,621 |
49.63% |
|
Candidates representing 5 parties stood for election to this seat.
|
|
 |
Anne Widdecombe
Conservative
|
| Con |
 |
23,657 |
44.13% |
| Lab |
 |
14,054 |
26.22% |
| LD |
 |
11,986 |
22.36% |
| Ref |
 |
1,998 |
3.73% |
| Oth |
 |
1,913 |
3.57% |
| Maj |
 |
9,603 |
17.91% |
| Turn |
 |
53,608 |
73.98% |
|
|
 |
|
Conservative
|
| Con |
 |
31,951 |
56.10% |
| Lab |
 |
7,097 |
12.50% |
| LD |
 |
17,237 |
30.30% |
| Oth |
 |
693 |
1.20% |
| Maj |
 |
14,714 |
25.80% |
| Turn |
 |
56,978 |
80.24% |
|
|
 |
|

|

