|
Makerfield
Labour hold

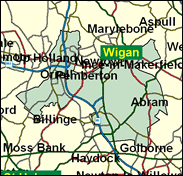
The largest town here is Ashton-in-Makerfield, and we may also find Ince-in-Makerfield. Where on earth is Makerfield? The answer is that it is on the industrial, not agricultural, part of the Lancashire plain near Wigan, its economy shaped by coal mining, although there are no pits here now. But the tradition remains, and in many ways this is a true heartland of Old Labour. There are virtually no non-white residents (0.4pc). There are well below the national average number of single parents, and nothing like the rate found in big cities. Migration is low. It is majority working class in occupation, but near the average in home ownership. Clearly new Labour can appeal just as strongly in such a place, for Ian McCartney won with a 26,000 majority in 1997.

Ian McCartney, possessor, at five feet, of the Commons lowest profile, and with no neck, a Scottish accent - it has been said - so thick you can slice it like haggis, and likened to a chubby, macho Glaswegian mouse, was elected here in 1987. He operates as a pugnacious working class, Tory-bashing Scottish version of his patron, John Prescott. He is currently Minister of State at the Cabinet Office, a rather job-lot sort of Department with ministers, such as Mo Mowlam, Lord Falconer and himself, of rather indeterminate purpose and compatibility.
 |
| Wealthy Achievers, Suburban Areas |
4.67% |
14.99% |
31.16 |
|
| Affluent Greys, Rural Communities |
0.00% |
2.13% |
0.00 |
|
| Prosperous Pensioners, Retirement Areas |
0.00% |
2.49% |
0.00 |
|
| Affluent Executives, Family Areas |
1.65% |
4.43% |
37.38 |
|
| Well-Off Workers, Family Areas |
31.68% |
7.27% |
435.53 |
|
| Affluent Urbanites, Town & City Areas |
0.00% |
2.56% |
0.00 |
|
| Prosperous Professionals, Metropolitan Areas |
0.00% |
2.04% |
0.00 |
|
| Better-Off Executives, Inner City Areas |
0.00% |
3.94% |
0.00 |
|
| Comfortable Middle Agers, Mature Home Owning Areas |
8.29% |
13.04% |
63.55 |
|
| Skilled Workers, Home Owning Areas |
21.91% |
12.70% |
172.52 |
|
| New Home Owners, Mature Communities |
13.12% |
8.14% |
161.12 |
|
| White Collar Workers, Better-Off Multi Ethnic Areas |
0.00% |
4.02% |
0.00 |
|
| Older People, Less Prosperous Areas |
3.59% |
3.19% |
112.72 |
|
| Council Estate Residents, Better-Off Homes |
9.45% |
11.31% |
83.54 |
|
| Council Estate Residents, High Unemployment |
2.19% |
3.06% |
71.43 |
|
| Council Estate Residents, Greatest Hardship |
3.45% |
2.52% |
136.88 |
|
| People in Multi-Ethnic, Low-Income Areas |
0.00% |
2.10% |
0.00 |
|
| Unclassified |
0.00% |
0.06% |
0.00 |
|
|
 |
 |
 |
| £0-5K |
9.68% |
9.41% |
102.85 |
|
| £5-10K |
17.94% |
16.63% |
107.88 |
|
| £10-15K |
18.26% |
16.58% |
110.12 |
|
| £15-20K |
14.89% |
13.58% |
109.63 |
|
| £20-25K |
11.10% |
10.39% |
106.77 |
|
| £25-30K |
7.95% |
7.77% |
102.31 |
|
| £30-35K |
5.62% |
5.79% |
96.95 |
|
| £35-40K |
3.95% |
4.33% |
91.23 |
|
| £40-45K |
2.79% |
3.27% |
85.51 |
|
| £45-50K |
1.99% |
2.48% |
79.97 |
|
| £50-55K |
1.42% |
1.90% |
74.75 |
|
| £55-60K |
1.03% |
1.47% |
69.89 |
|
| £60-65K |
0.75% |
1.15% |
65.40 |
|
| £65-70K |
0.56% |
0.91% |
61.29 |
|
| £70-75K |
0.41% |
0.72% |
57.53 |
|
| £75-80K |
0.31% |
0.57% |
54.09 |
|
| £80-85K |
0.24% |
0.46% |
50.95 |
|
| £85-90K |
0.18% |
0.37% |
48.08 |
|
| £90-95K |
0.14% |
0.31% |
45.46 |
|
| £95-100K |
0.11% |
0.25% |
43.05 |
|
| £100K + |
0.43% |
1.34% |
32.23 |
|
|
|

|


|
1992-1997
|
1997-2001
|
|
|
|
| Con |
-8.98% |
| Lab |
10.27% |
| LD |
-0.88% |
|
| Con |
2.16% |
| Lab |
-5.07% |
| LD |
3.13% |
|
|
 |
Ian McCartney
Labour hold
|
| Con |
 |
6,129 |
17.58% |
| Lab |
 |
23,879 |
68.51% |
| LD |
 |
3,990 |
11.45% |
| Oth |
 |
858 |
2.46% |
| Maj |
 |
17,750 |
50.92% |
| Turn |
 |
34,856 |
50.92% |
|
|
 |
Ian McCartney
Labour hold
|
| C |
Jane Brooks |
6,129 |
17.58% |
| LD |
David Crowther |
3,990 |
11.45% |
| SA |
Malcolm Jones |
858 |
2.46% |
| L |
Ian McCartney |
23,879 |
68.51% |
|
Candidates representing 4 parties stood for election to this seat.
|
|
 |
Ian McCartney
Labour
|
| Con |
 |
6,942 |
15.42% |
| Lab |
 |
33,119 |
73.57% |
| LD |
 |
3,743 |
8.32% |
| Ref |
 |
1,210 |
2.69% |
| Oth |
|
0 |
0.00% |
| Maj |
 |
26,177 |
58.15% |
| Turn |
 |
45,014 |
66.83% |
|
|
 |
|
Labour
|
| Con |
 |
12,640 |
24.40% |
| Lab |
 |
32,787 |
63.30% |
| LD |
 |
4,751 |
9.20% |
| Oth |
 |
1,582 |
3.10% |
| Maj |
 |
20,147 |
38.90% |
| Turn |
 |
51,760 |
75.50% |
|
|
 |
|

|

