|
Maldon & East Chelmsford
Conservative hold

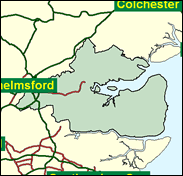
There was a swing of over 15pc to Labour in Maldon and Chelmsford East in 1997, but the Tories still won by a five figure majority. One of the reasons for this was that previously Labour had been a poor third. They more than doubled their share, from 13pc to 29pc, which was one of the best proportional increases anywhere. Why? Partly the answer was that Essex, having swung away from Old Labour and towards Thatcherism in the 1980s, is now returning to older allegiances; after all, the Conservatives had only beaten them by 600 in the Maldon seat in 1966. Another is that this was a newly drawn seat in 1997, and it was not clear who was likely to come second, so there was little incentive for tactical voting, which clearly helped the Liberal Democrats in so many parts of the country. Nevertheless, the fact is that the seat is, overall, very Conservative, with nearly an absolute majority of the vote, so tactics don't really come into it. It includes none of the county town of Chelmsford itself, but only middle-class suburbs like Great Baddow, and most of the acreage is made up of the flat lands between the broad estuaries and creeks of the Crouch and other rivers, a veritable waterland.

John Whittingdale, William Hague’s PPS since 1999, was first elected in 1992. A former political secretary of Margaret Thatcher, he rebelled against Maastricht too little for her but too much for John Major. Born 1959 and educated at Winchester (where he was seen as a bit of a Widmerpool) and at University College London, he worked almost exclusively as a party staffer before reaching the Commons, and after voting for Redwood sought to get Margaret Thatcher to block the Clarke-Redwood pact in the leadership election in 1997. His Thatcherism, like that of Portillo (whom he has backed), is modulated by the realism of the professional politician.
 |
| Wealthy Achievers, Suburban Areas |
34.96% |
14.99% |
233.15 |
|
| Affluent Greys, Rural Communities |
1.22% |
2.13% |
57.59 |
|
| Prosperous Pensioners, Retirement Areas |
1.43% |
2.49% |
57.58 |
|
| Affluent Executives, Family Areas |
7.31% |
4.43% |
165.12 |
|
| Well-Off Workers, Family Areas |
10.59% |
7.27% |
145.63 |
|
| Affluent Urbanites, Town & City Areas |
0.22% |
2.56% |
8.43 |
|
| Prosperous Professionals, Metropolitan Areas |
0.08% |
2.04% |
3.81 |
|
| Better-Off Executives, Inner City Areas |
0.30% |
3.94% |
7.62 |
|
| Comfortable Middle Agers, Mature Home Owning Areas |
21.46% |
13.04% |
164.62 |
|
| Skilled Workers, Home Owning Areas |
5.89% |
12.70% |
46.39 |
|
| New Home Owners, Mature Communities |
8.22% |
8.14% |
100.94 |
|
| White Collar Workers, Better-Off Multi Ethnic Areas |
2.25% |
4.02% |
55.95 |
|
| Older People, Less Prosperous Areas |
3.33% |
3.19% |
104.45 |
|
| Council Estate Residents, Better-Off Homes |
2.63% |
11.31% |
23.27 |
|
| Council Estate Residents, High Unemployment |
0.11% |
3.06% |
3.47 |
|
| Council Estate Residents, Greatest Hardship |
0.00% |
2.52% |
0.00 |
|
| People in Multi-Ethnic, Low-Income Areas |
0.00% |
2.10% |
0.00 |
|
| Unclassified |
0.00% |
0.06% |
0.00 |
|
|
 |
|
|
| £0-5K |
6.91% |
9.41% |
73.44 |
|
| £5-10K |
12.49% |
16.63% |
75.08 |
|
| £10-15K |
13.73% |
16.58% |
82.82 |
|
| £15-20K |
12.47% |
13.58% |
91.82 |
|
| £20-25K |
10.47% |
10.39% |
100.79 |
|
| £25-30K |
8.50% |
7.77% |
109.29 |
|
| £30-35K |
6.79% |
5.79% |
117.19 |
|
| £35-40K |
5.39% |
4.33% |
124.47 |
|
| £40-45K |
4.28% |
3.27% |
131.16 |
|
| £45-50K |
3.41% |
2.48% |
137.31 |
|
| £50-55K |
2.72% |
1.90% |
142.98 |
|
| £55-60K |
2.19% |
1.47% |
148.23 |
|
| £60-65K |
1.76% |
1.15% |
153.09 |
|
| £65-70K |
1.43% |
0.91% |
157.63 |
|
| £70-75K |
1.16% |
0.72% |
161.87 |
|
| £75-80K |
0.95% |
0.57% |
165.85 |
|
| £80-85K |
0.78% |
0.46% |
169.59 |
|
| £85-90K |
0.65% |
0.37% |
173.13 |
|
| £90-95K |
0.54% |
0.31% |
176.47 |
|
| £95-100K |
0.45% |
0.25% |
179.65 |
|
| £100K + |
2.65% |
1.34% |
197.19 |
|
|
|
|


|
1992-1997
|
1997-2001
|
|
|
|
| Con |
-15.23% |
| Lab |
15.95% |
| LD |
-2.63% |
|
| Con |
0.58% |
| Lab |
1.31% |
| LD |
-3.49% |
|
|
|
John Whittingdale
Conservative hold
|
| Con |
 |
21,719 |
49.25% |
| Lab |
 |
13,257 |
30.06% |
| LD |
 |
7,002 |
15.88% |
| Oth |
 |
2,122 |
4.81% |
| Maj |
 |
8,462 |
19.19% |
| Turn |
|
44,100 |
63.73% |
|
|
|
John Whittingdale
Conservative hold
|
| UK |
Geoffrey Harris |
1,135 |
2.57% |
| LD |
Jane Jackson |
7,002 |
15.88% |
| L |
Russell Kennedy |
13,257 |
30.06% |
| G |
Walter Schwarz |
987 |
2.24% |
| C |
John Whittingdale |
21,719 |
49.25% |
|
Candidates representing 5 parties stood for election to this seat.
|
|
|
John Whittingdale
Conservative
|
| Con |
|
24,524 |
48.67% |
| Lab |
|
14,485 |
28.75% |
| LD |
|
9,758 |
19.37% |
| Ref |
|
0 |
0.00% |
| Oth |
|
1,620 |
3.22% |
| Maj |
|
10,039 |
19.92% |
| Turn |
|
50,387 |
76.13% |
|
|
|
|
Conservative
|
| Con |
|
32,944 |
63.90% |
| Lab |
|
6,592 |
12.80% |
| LD |
|
11,359 |
22.00% |
| Oth |
|
696 |
1.30% |
| Maj |
|
21,585 |
41.80% |
| Turn |
|
51,591 |
79.72% |
|
|
|
|
|