|
Manchester, Blackley
Labour hold

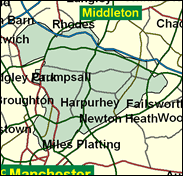
The Conservatives once again won no wards at all and returned a zero number of councillors to Manchester City Council in the latest elections there in May 2000. The great north-western city will again return a full slate of Labour MPs at the next General Election. It is hard now to remember that, as in Liverpool, the Tories held a number of parliamentary seats here back in the 1950s, including Blackley in the north east of the city, when Labour's majority is now over 50pc of all the votes cast, the normal benchline for a super-safe seat.

Graham Stringer, a tall, burly, poker-faced former leader of Manchester Council, is a recycled hard leftwinger-turned-New-Labour Minister, currently in the Cabinet Office. Elected here in 1997, he was Manchester-born in 1950 and educated at Merton Brock High School and Sheffield University. An energetic defender of Manchester commercial interests when Council leader, he backs elected Mayors but opposes regional government as a threat to big city power. An effective ward-heeler and local party manager, he vigorously backs expansion of Manchester airport to the dismay of Martin Bell’s Cheshire gin-and-Jag-belt constituents. He takes a lot of interest in sport.
 |
| Wealthy Achievers, Suburban Areas |
0.06% |
14.99% |
0.40 |
|
| Affluent Greys, Rural Communities |
0.00% |
2.13% |
0.00 |
|
| Prosperous Pensioners, Retirement Areas |
0.55% |
2.49% |
22.27 |
|
| Affluent Executives, Family Areas |
0.49% |
4.43% |
11.11 |
|
| Well-Off Workers, Family Areas |
1.38% |
7.27% |
18.96 |
|
| Affluent Urbanites, Town & City Areas |
0.75% |
2.56% |
29.44 |
|
| Prosperous Professionals, Metropolitan Areas |
0.00% |
2.04% |
0.00 |
|
| Better-Off Executives, Inner City Areas |
3.94% |
3.94% |
99.98 |
|
| Comfortable Middle Agers, Mature Home Owning Areas |
8.44% |
13.04% |
64.71 |
|
| Skilled Workers, Home Owning Areas |
24.98% |
12.70% |
196.65 |
|
| New Home Owners, Mature Communities |
7.67% |
8.14% |
94.21 |
|
| White Collar Workers, Better-Off Multi Ethnic Areas |
2.18% |
4.02% |
54.17 |
|
| Older People, Less Prosperous Areas |
2.22% |
3.19% |
69.66 |
|
| Council Estate Residents, Better-Off Homes |
29.65% |
11.31% |
262.16 |
|
| Council Estate Residents, High Unemployment |
7.27% |
3.06% |
237.57 |
|
| Council Estate Residents, Greatest Hardship |
5.00% |
2.52% |
198.59 |
|
| People in Multi-Ethnic, Low-Income Areas |
5.35% |
2.10% |
254.67 |
|
| Unclassified |
0.06% |
0.06% |
88.61 |
|
|
 |
 |
 |
| £0-5K |
15.30% |
9.41% |
162.57 |
|
| £5-10K |
23.25% |
16.63% |
139.78 |
|
| £10-15K |
19.75% |
16.58% |
119.10 |
|
| £15-20K |
13.84% |
13.58% |
101.89 |
|
| £20-25K |
9.13% |
10.39% |
87.82 |
|
| £25-30K |
5.93% |
7.77% |
76.33 |
|
| £30-35K |
3.88% |
5.79% |
66.91 |
|
| £35-40K |
2.56% |
4.33% |
59.13 |
|
| £40-45K |
1.72% |
3.27% |
52.66 |
|
| £45-50K |
1.17% |
2.48% |
47.24 |
|
| £50-55K |
0.81% |
1.90% |
42.67 |
|
| £55-60K |
0.57% |
1.47% |
38.78 |
|
| £60-65K |
0.41% |
1.15% |
35.45 |
|
| £65-70K |
0.30% |
0.91% |
32.58 |
|
| £70-75K |
0.22% |
0.72% |
30.10 |
|
| £75-80K |
0.16% |
0.57% |
27.93 |
|
| £80-85K |
0.12% |
0.46% |
26.02 |
|
| £85-90K |
0.09% |
0.37% |
24.34 |
|
| £90-95K |
0.07% |
0.31% |
22.84 |
|
| £95-100K |
0.05% |
0.25% |
21.51 |
|
| £100K + |
0.22% |
1.34% |
16.03 |
|
|
|

|


|
1992-1997
|
1997-2001
|
|
|
|
| Con |
-10.75% |
| Lab |
7.84% |
| LD |
0.01% |
|
| Con |
-0.85% |
| Lab |
-1.10% |
| LD |
0.36% |
|
|
 |
Graham Stringer
Labour hold
|
| Con |
 |
3,821 |
14.41% |
| Lab |
 |
18,285 |
68.94% |
| LD |
 |
3,015 |
11.37% |
| Oth |
 |
1,402 |
5.29% |
| Maj |
 |
14,464 |
54.53% |
| Turn |
 |
26,523 |
44.87% |
|
|
 |
Graham Stringer
Labour hold
|
| SL |
Kevin Barr |
485 |
1.83% |
| AC |
Aziz Bhatti |
456 |
1.72% |
| SA |
Karen Reissmann |
461 |
1.74% |
| LD |
Gary Riding |
3,015 |
11.37% |
| C |
Lance Stanbury |
3,821 |
14.41% |
| L |
Graham Stringer |
18,285 |
68.94% |
|
Candidates representing 6 parties stood for election to this seat.
|
|
 |
Graham Stringer
Labour
|
| Con |
 |
5,454 |
15.25% |
| Lab |
 |
25,042 |
70.04% |
| LD |
 |
3,937 |
11.01% |
| Ref |
 |
1,323 |
3.70% |
| Oth |
|
0 |
0.00% |
| Maj |
 |
19,588 |
54.78% |
| Turn |
 |
35,756 |
57.46% |
|
|
 |
|
Labour
|
| Con |
 |
11,285 |
26.00% |
| Lab |
 |
26,977 |
62.20% |
| LD |
 |
4,786 |
11.00% |
| Oth |
 |
342 |
0.80% |
| Maj |
 |
15,692 |
36.20% |
| Turn |
 |
43,390 |
66.43% |
|
|
 |
|

|

