|
Manchester, Central
Labour hold

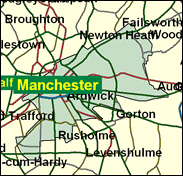
The great landmarks of the heart of a great city are all here: St Peter's Square with the Central Library, and Piccadilly, and the old commercial buildings which once housed the headquarters of great cotton and trading companies, and Chinatown, or more modern developments like the G-Mex centre and the Arndale, blasted by an IRA bomb in the Nineties; but it also contains a swathe of poor and multiply deprived inner city neighbourhoods on every side of the city, many of whose names have become nationally notorious for unliveable conditions and high crime rates: Beswick, Hulme, Moss Side and Ancoats, identified as a slum as far back as the 1840s by Marx's collaborator Friedrich Engels in The Condition of the Working Class in England. This seat, not surprisingly, saw one of the highest Labour majorities even though its turnout, at 53pc, was one of the lowest in Britain.

Tony Lloyd, one of Blair’s dropped jobbing ministers in 1999, narrowly missed election by 6 votes as PLP Chairman in 2000. Mancunian-brogued, and of somewhat lugubrious countenance, he was first elected in 1983 and soon set up as a routine North West/Mancunian regionalist. Born 1950, Stretford Grammar School and Nottingham University-educated, a former accountant and lecturer, a Prescott-voter in 1994, he performed weakly under questioning on Sierra Leone in the Foreign Affairs Select Committee and lost his ministerial job in the second annual reshuffle in 1999.
 |
| Wealthy Achievers, Suburban Areas |
0.97% |
14.99% |
6.50 |
|
| Affluent Greys, Rural Communities |
0.07% |
2.13% |
3.23 |
|
| Prosperous Pensioners, Retirement Areas |
0.39% |
2.49% |
15.70 |
|
| Affluent Executives, Family Areas |
0.11% |
4.43% |
2.58 |
|
| Well-Off Workers, Family Areas |
0.27% |
7.27% |
3.77 |
|
| Affluent Urbanites, Town & City Areas |
3.83% |
2.56% |
149.45 |
|
| Prosperous Professionals, Metropolitan Areas |
0.37% |
2.04% |
17.99 |
|
| Better-Off Executives, Inner City Areas |
10.70% |
3.94% |
271.21 |
|
| Comfortable Middle Agers, Mature Home Owning Areas |
0.37% |
13.04% |
2.86 |
|
| Skilled Workers, Home Owning Areas |
11.20% |
12.70% |
88.19 |
|
| New Home Owners, Mature Communities |
0.92% |
8.14% |
11.25 |
|
| White Collar Workers, Better-Off Multi Ethnic Areas |
6.30% |
4.02% |
156.55 |
|
| Older People, Less Prosperous Areas |
0.13% |
3.19% |
4.18 |
|
| Council Estate Residents, Better-Off Homes |
31.25% |
11.31% |
276.25 |
|
| Council Estate Residents, High Unemployment |
10.71% |
3.06% |
349.70 |
|
| Council Estate Residents, Greatest Hardship |
7.94% |
2.52% |
315.42 |
|
| People in Multi-Ethnic, Low-Income Areas |
14.21% |
2.10% |
676.62 |
|
| Unclassified |
0.26% |
0.06% |
410.67 |
|
|
 |
 |
 |
| £0-5K |
18.43% |
9.41% |
195.77 |
|
| £5-10K |
24.63% |
16.63% |
148.07 |
|
| £10-15K |
19.07% |
16.58% |
114.99 |
|
| £15-20K |
12.54% |
13.58% |
92.29 |
|
| £20-25K |
7.95% |
10.39% |
76.53 |
|
| £25-30K |
5.08% |
7.77% |
65.33 |
|
| £30-35K |
3.31% |
5.79% |
57.17 |
|
| £35-40K |
2.21% |
4.33% |
51.10 |
|
| £40-45K |
1.52% |
3.27% |
46.48 |
|
| £45-50K |
1.06% |
2.48% |
42.90 |
|
| £50-55K |
0.76% |
1.90% |
40.07 |
|
| £55-60K |
0.56% |
1.47% |
37.80 |
|
| £60-65K |
0.41% |
1.15% |
35.95 |
|
| £65-70K |
0.31% |
0.91% |
34.42 |
|
| £70-75K |
0.24% |
0.72% |
33.15 |
|
| £75-80K |
0.18% |
0.57% |
32.06 |
|
| £80-85K |
0.14% |
0.46% |
31.14 |
|
| £85-90K |
0.11% |
0.37% |
30.33 |
|
| £90-95K |
0.09% |
0.31% |
29.63 |
|
| £95-100K |
0.07% |
0.25% |
29.01 |
|
| £100K + |
0.36% |
1.34% |
26.42 |
|
|
|

|


|
1992-1997
|
1997-2001
|
|
|
|
| Con |
-7.58% |
| Lab |
1.88% |
| LD |
1.79% |
|
| Con |
-2.84% |
| Lab |
-2.28% |
| LD |
3.41% |
|
|
 |
Tony Lloyd
Labour hold
|
| Con |
 |
2,328 |
8.98% |
| Lab |
 |
17,812 |
68.70% |
| LD |
 |
4,070 |
15.70% |
| Oth |
 |
1,718 |
6.63% |
| Maj |
 |
13,742 |
53.00% |
| Turn |
 |
25,928 |
39.13% |
|
|
 |
Tony Lloyd
Labour hold
|
| P |
Terrenia Brosnan |
216 |
0.83% |
| G |
Vanessa Hill |
1,018 |
3.93% |
| LD |
Philip Hobson |
4,070 |
15.70% |
| L |
Tony Lloyd |
17,812 |
68.70% |
| C |
Aaron Powell |
2,328 |
8.98% |
| SL |
Ron Sinclair |
484 |
1.87% |
|
Candidates representing 6 parties stood for election to this seat.
|
|
 |
Tony Lloyd
Labour
|
| Con |
 |
3,964 |
11.82% |
| Lab |
 |
23,803 |
70.98% |
| LD |
 |
4,121 |
12.29% |
| Ref |
 |
742 |
2.21% |
| Oth |
 |
907 |
2.70% |
| Maj |
 |
19,682 |
58.69% |
| Turn |
 |
33,537 |
52.55% |
|
|
 |
|
Labour
|
| Con |
 |
7,581 |
19.40% |
| Lab |
 |
27,009 |
69.10% |
| LD |
 |
4,105 |
10.50% |
| Oth |
 |
370 |
0.90% |
| Maj |
 |
19,428 |
49.70% |
| Turn |
 |
39,065 |
58.77% |
|
|
 |
|

|

