|
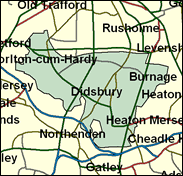
Manchester, Withington
Labour hold

Once the middle class Tory citadel of south Manchester, held even in 1966 when Labour won an overall majority of 100, and including the most upmarket ward within the city boundaries, Withington was gained by Labour in 1992 by a handsome margin and that figure increased to an impregnable 18,500 in 1997. This represents very rapid social as well as political change. The middle class families who formed the solid core of society here have, in general, migrated south out of the city into what was Cheshire and is now included in Metropolitan boroughs such as Stockport and Trafford, leaving Withington's substantial housing to multi-occupation including by one of the largest student communities in Britain. The flavour has changed to become that given by more young and single residents. As elsewhere in Manchester, the Liberal Democrats are advancing in local elections (they won nine seats on the city council in May 2000 to Labour's 23 and the Tories' none), but they can make no impact on Labour as yet in national contests.

Keith Bradley, a Deputy Chief Whip, having discarded both a beard and a routinely municipal left wing past on Manchester City Council, was elected here in 1987, and as a frontbencher specialised in Social Security policy. Born 1950 and educated at Bishop Vesey’s Grammar School, Sutton Coldfield, Manchester Polytechnic and York University, he worked previously as an NHS bureaucrat. As number two in the Whips office, he won’t want to be reminded that in February 1997 he said Labour was “completely opposed to the privatisation of the National Air Traffic Control Services”.
 |
| Wealthy Achievers, Suburban Areas |
9.10% |
14.99% |
60.70 |
|
| Affluent Greys, Rural Communities |
0.00% |
2.13% |
0.00 |
|
| Prosperous Pensioners, Retirement Areas |
0.76% |
2.49% |
30.56 |
|
| Affluent Executives, Family Areas |
0.07% |
4.43% |
1.58 |
|
| Well-Off Workers, Family Areas |
0.66% |
7.27% |
9.03 |
|
| Affluent Urbanites, Town & City Areas |
14.78% |
2.56% |
576.40 |
|
| Prosperous Professionals, Metropolitan Areas |
7.93% |
2.04% |
388.31 |
|
| Better-Off Executives, Inner City Areas |
18.87% |
3.94% |
478.45 |
|
| Comfortable Middle Agers, Mature Home Owning Areas |
9.88% |
13.04% |
75.74 |
|
| Skilled Workers, Home Owning Areas |
1.02% |
12.70% |
8.00 |
|
| New Home Owners, Mature Communities |
3.60% |
8.14% |
44.24 |
|
| White Collar Workers, Better-Off Multi Ethnic Areas |
11.92% |
4.02% |
296.46 |
|
| Older People, Less Prosperous Areas |
0.50% |
3.19% |
15.72 |
|
| Council Estate Residents, Better-Off Homes |
10.28% |
11.31% |
90.91 |
|
| Council Estate Residents, High Unemployment |
5.70% |
3.06% |
186.05 |
|
| Council Estate Residents, Greatest Hardship |
4.10% |
2.52% |
162.65 |
|
| People in Multi-Ethnic, Low-Income Areas |
0.43% |
2.10% |
20.24 |
|
| Unclassified |
0.42% |
0.06% |
669.04 |
|
|
 |
 |
 |
| £0-5K |
9.38% |
9.41% |
99.59 |
|
| £5-10K |
16.05% |
16.63% |
96.49 |
|
| £10-15K |
15.73% |
16.58% |
94.88 |
|
| £15-20K |
12.87% |
13.58% |
94.72 |
|
| £20-25K |
9.94% |
10.39% |
95.63 |
|
| £25-30K |
7.55% |
7.77% |
97.16 |
|
| £30-35K |
5.74% |
5.79% |
99.03 |
|
| £35-40K |
4.38% |
4.33% |
101.02 |
|
| £40-45K |
3.36% |
3.27% |
103.05 |
|
| £45-50K |
2.61% |
2.48% |
105.05 |
|
| £50-55K |
2.04% |
1.90% |
106.98 |
|
| £55-60K |
1.60% |
1.47% |
108.84 |
|
| £60-65K |
1.27% |
1.15% |
110.63 |
|
| £65-70K |
1.02% |
0.91% |
112.33 |
|
| £70-75K |
0.82% |
0.72% |
113.97 |
|
| £75-80K |
0.66% |
0.57% |
115.54 |
|
| £80-85K |
0.54% |
0.46% |
117.04 |
|
| £85-90K |
0.44% |
0.37% |
118.49 |
|
| £90-95K |
0.37% |
0.31% |
119.89 |
|
| £95-100K |
0.30% |
0.25% |
121.24 |
|
| £100K + |
1.74% |
1.34% |
129.64 |
|
|
|

|


|
1992-1997
|
1997-2001
|
|
|
|
| Con |
-11.94% |
| Lab |
8.86% |
| LD |
-0.57% |
|
| Con |
-4.10% |
| Lab |
-6.67% |
| LD |
8.38% |
|
|
 |
Keith Bradley
Labour hold
|
| Con |
 |
5,349 |
15.26% |
| Lab |
 |
19,239 |
54.89% |
| LD |
 |
7,715 |
22.01% |
| Oth |
 |
2,747 |
7.84% |
| Maj |
 |
11,524 |
32.88% |
| Turn |
 |
35,050 |
51.94% |
|
|
 |
Keith Bradley
Labour hold
|
| L |
Keith Bradley |
19,239 |
54.89% |
| SA |
John Clegg |
1,208 |
3.45% |
| C |
Julian Samways |
5,349 |
15.26% |
| G |
Michelle Valentine |
1,539 |
4.39% |
| LD |
Yasmin Zalzala |
7,715 |
22.01% |
|
Candidates representing 5 parties stood for election to this seat.
|
|
 |
Keith Bradley
Labour
|
| Con |
 |
8,522 |
19.36% |
| Lab |
 |
27,103 |
61.56% |
| LD |
 |
6,000 |
13.63% |
| Ref |
 |
1,079 |
2.45% |
| Oth |
 |
1,323 |
3.00% |
| Maj |
 |
18,581 |
42.20% |
| Turn |
 |
44,027 |
66.59% |
|
|
 |
|
Labour
|
| Con |
 |
14,193 |
31.30% |
| Lab |
 |
23,907 |
52.70% |
| LD |
 |
6,442 |
14.20% |
| Oth |
 |
851 |
1.90% |
| Maj |
 |
9,714 |
21.40% |
| Turn |
 |
45,393 |
70.94% |
|
|
 |
|

|

