|
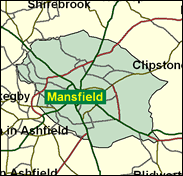
Mansfield
Labour hold

The metropolis of the Nottinghamshire coalfield, together with South Yorkshire's the only one of any importance remaining, and that in steep decline, Mansfield's adherence to the Labour party has risen, fallen and risen again with the politics of the coal industry. Solidly loyal to Labour until the 1980s, the majority was sharply slashed after much of Nottinghamshire worked through the 1984-5 strike called by Arthur Scargill, a Yorkshireman, without recourse to a national ballot. Much bad blood was created, and some spilt, among the miners, and Notts was the birthplace of the "moderate" Union of Democratic Mineworkers, which broke away from the more militant NUM. Then many Nottinghamshire pits were closed by the Conservative government anyway, and Mansfield swung back dramatically to Labour; and in 1997 Alan Meale's majority, 56 votes in 1987, had metamorphosed into 20,518.

Alan Meale, one of Blair’s sacked ministers, had risen precariously as a Prescott-backed junior minister in Prescott’s department, making his name previously as an animal (especially badger) protection buff and before all that as a hard left Campaign Group supporter before winning the seat in 1987. He was born 1949 in County Durham and Catholic-school-educated before, eventually, acquiring a degree in creative writing from Sheffield Polytechnic. Astigmatic and Zapata-moustached, and initially for eleven years a manual worker, his trajectory from hard left groupy to pipe-smoking animal welfarist, did not help him when he became embroiled, as a backer of Greek Cyprus, with a Cypriot businessman, for though exonerated of wrong-doing he lost his job in the 1999 reshuffle.
 |
| Wealthy Achievers, Suburban Areas |
9.70% |
14.99% |
64.71 |
|
| Affluent Greys, Rural Communities |
0.00% |
2.13% |
0.00 |
|
| Prosperous Pensioners, Retirement Areas |
0.67% |
2.49% |
26.89 |
|
| Affluent Executives, Family Areas |
5.94% |
4.43% |
134.20 |
|
| Well-Off Workers, Family Areas |
10.48% |
7.27% |
144.08 |
|
| Affluent Urbanites, Town & City Areas |
0.12% |
2.56% |
4.71 |
|
| Prosperous Professionals, Metropolitan Areas |
0.00% |
2.04% |
0.00 |
|
| Better-Off Executives, Inner City Areas |
1.27% |
3.94% |
32.25 |
|
| Comfortable Middle Agers, Mature Home Owning Areas |
12.39% |
13.04% |
95.05 |
|
| Skilled Workers, Home Owning Areas |
24.76% |
12.70% |
194.89 |
|
| New Home Owners, Mature Communities |
14.38% |
8.14% |
176.54 |
|
| White Collar Workers, Better-Off Multi Ethnic Areas |
0.60% |
4.02% |
14.82 |
|
| Older People, Less Prosperous Areas |
5.81% |
3.19% |
182.41 |
|
| Council Estate Residents, Better-Off Homes |
7.66% |
11.31% |
67.70 |
|
| Council Estate Residents, High Unemployment |
2.03% |
3.06% |
66.18 |
|
| Council Estate Residents, Greatest Hardship |
4.20% |
2.52% |
166.83 |
|
| People in Multi-Ethnic, Low-Income Areas |
0.00% |
2.10% |
0.00 |
|
| Unclassified |
0.00% |
0.06% |
0.00 |
|
|
 |
 |
 |
| £0-5K |
13.88% |
9.41% |
147.43 |
|
| £5-10K |
22.14% |
16.63% |
133.09 |
|
| £10-15K |
19.35% |
16.58% |
116.69 |
|
| £15-20K |
13.94% |
13.58% |
102.65 |
|
| £20-25K |
9.47% |
10.39% |
91.13 |
|
| £25-30K |
6.35% |
7.77% |
81.69 |
|
| £30-35K |
4.28% |
5.79% |
73.87 |
|
| £35-40K |
2.92% |
4.33% |
67.33 |
|
| £40-45K |
2.02% |
3.27% |
61.81 |
|
| £45-50K |
1.42% |
2.48% |
57.10 |
|
| £50-55K |
1.01% |
1.90% |
53.05 |
|
| £55-60K |
0.73% |
1.47% |
49.55 |
|
| £60-65K |
0.54% |
1.15% |
46.49 |
|
| £65-70K |
0.40% |
0.91% |
43.81 |
|
| £70-75K |
0.30% |
0.72% |
41.44 |
|
| £75-80K |
0.23% |
0.57% |
39.33 |
|
| £80-85K |
0.17% |
0.46% |
37.46 |
|
| £85-90K |
0.13% |
0.37% |
35.77 |
|
| £90-95K |
0.10% |
0.31% |
34.26 |
|
| £95-100K |
0.08% |
0.25% |
32.89 |
|
| £100K + |
0.36% |
1.34% |
26.94 |
|
|
|

|


|
1992-1997
|
1997-2001
|
|
|
|
| Con |
-11.93% |
| Lab |
10.03% |
| LD |
-1.54% |
|
| Con |
6.00% |
| Lab |
-7.31% |
| LD |
4.65% |
|
|
 |
Alan Meale
Labour hold
|
| Con |
 |
10,012 |
27.17% |
| Lab |
 |
21,050 |
57.12% |
| LD |
 |
5,790 |
15.71% |
| Oth |
|
0 |
0.00% |
| Maj |
 |
11,038 |
29.95% |
| Turn |
 |
36,852 |
55.21% |
|
|
 |
Alan Meale
Labour hold
|
| LD |
Tim Hill |
5,790 |
15.71% |
| L |
Alan Meale |
21,050 |
57.12% |
| C |
William Wellesley |
10,012 |
27.17% |
|
Candidates representing 3 parties stood for election to this seat.
|
|
 |
Alan Meale
Labour
|
| Con |
 |
10,038 |
21.17% |
| Lab |
 |
30,556 |
64.43% |
| LD |
 |
5,244 |
11.06% |
| Ref |
 |
1,588 |
3.35% |
| Oth |
|
0 |
0.00% |
| Maj |
 |
20,518 |
43.26% |
| Turn |
 |
47,426 |
70.72% |
|
|
 |
|
Labour
|
| Con |
 |
18,208 |
33.10% |
| Lab |
 |
29,932 |
54.40% |
| LD |
 |
6,925 |
12.60% |
| Oth |
|
0 |
0.00% |
| Maj |
 |
11,724 |
21.30% |
| Turn |
 |
55,065 |
81.45% |
|
|
 |
|

|

