|
Meirionnydd Nant Conwy
Plaid Cymru hold

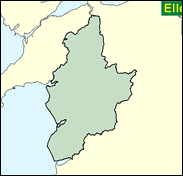
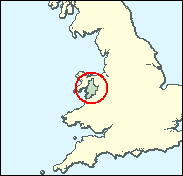
In the USA "ethnic minority" congressional districts are created by law (the Voting Rights Act) to provide guaranteed representation for black and Hispanic people (though not Asians or other groups). The nearest thing we have to this in Britain is the Welsh-speaking seat of Meirionnydd Nant Conwy, a seat of only 32,000 electors (the Welsh average is 58,000, the UK average nearly 70,000). This over-representation is theoretically justified by the harsh and mountainous terrain of Snowdonia that it covers, but it guarantees another seat for Plaid Cymru, and a suggestion to make electorates more equal by including a substantial part of the English speaking north (Conwy) coast was abandoned after a storm of protest, which was certainly of a political nature even if that was not overtly admitted. This seat is now effectively a one party state, even more so in the Welsh Assembly elections of 1999, as might be expected, when it returned a former MP here, Lord Elis-Thomas.

Elfyn Llwyd, Plaid Cymru’s MP here since 1992, and its Commons leader since 1999, is something of a paradox: a genial small town solicitor with an unzealous, unpartisan manner, who nonetheless as a student changed his surname from Hughes to the rare Welsh name of ‘Llwyd’, and who believes that “the Welsh speaker is a second-class citizen in his own country”, a scarcely credible notion in the densely-Welsh-speaking part of Wales he inhabits. Born into a Nationalist family in 1951, he attended Llanrwst Grammar School, Ysgol Aberconwy, Llanrwst, Aberystwyth University and Chester Law College. Like his Plaid colleagues, he votes a leftist ticket on non-Nationalist issues such as defence, Iraq, homosexual age of consent, and jury trials. There are shades of Lloyd George Liberalism here, as befits one who served his legal apprenticeship under Lloyd George’s nephew in Portmadoc. But his call for all Welsh Court lawyers to be bilingual could smack of restrictive practice.
 |
| Wealthy Achievers, Suburban Areas |
1.10% |
14.99% |
7.32 |
|
| Affluent Greys, Rural Communities |
46.99% |
2.13% |
2,209.95 |
|
| Prosperous Pensioners, Retirement Areas |
1.38% |
2.49% |
55.56 |
|
| Affluent Executives, Family Areas |
0.00% |
4.43% |
0.00 |
|
| Well-Off Workers, Family Areas |
0.00% |
7.27% |
0.00 |
|
| Affluent Urbanites, Town & City Areas |
0.46% |
2.56% |
17.89 |
|
| Prosperous Professionals, Metropolitan Areas |
0.00% |
2.04% |
0.00 |
|
| Better-Off Executives, Inner City Areas |
0.03% |
3.94% |
0.88 |
|
| Comfortable Middle Agers, Mature Home Owning Areas |
11.65% |
13.04% |
89.38 |
|
| Skilled Workers, Home Owning Areas |
14.58% |
12.70% |
114.74 |
|
| New Home Owners, Mature Communities |
10.27% |
8.14% |
126.12 |
|
| White Collar Workers, Better-Off Multi Ethnic Areas |
4.74% |
4.02% |
117.94 |
|
| Older People, Less Prosperous Areas |
4.61% |
3.19% |
144.63 |
|
| Council Estate Residents, Better-Off Homes |
2.59% |
11.31% |
22.89 |
|
| Council Estate Residents, High Unemployment |
0.00% |
3.06% |
0.00 |
|
| Council Estate Residents, Greatest Hardship |
1.60% |
2.52% |
63.45 |
|
| People in Multi-Ethnic, Low-Income Areas |
0.00% |
2.10% |
0.00 |
|
| Unclassified |
0.00% |
0.06% |
0.00 |
|
|
 |
 |
 |
| £0-5K |
11.87% |
9.41% |
126.12 |
|
| £5-10K |
21.94% |
16.63% |
131.91 |
|
| £10-15K |
20.40% |
16.58% |
123.03 |
|
| £15-20K |
14.99% |
13.58% |
110.33 |
|
| £20-25K |
10.14% |
10.39% |
97.55 |
|
| £25-30K |
6.68% |
7.77% |
85.94 |
|
| £30-35K |
4.39% |
5.79% |
75.80 |
|
| £35-40K |
2.91% |
4.33% |
67.10 |
|
| £40-45K |
1.95% |
3.27% |
59.66 |
|
| £45-50K |
1.32% |
2.48% |
53.30 |
|
| £50-55K |
0.91% |
1.90% |
47.85 |
|
| £55-60K |
0.64% |
1.47% |
43.16 |
|
| £60-65K |
0.45% |
1.15% |
39.10 |
|
| £65-70K |
0.32% |
0.91% |
35.57 |
|
| £70-75K |
0.23% |
0.72% |
32.48 |
|
| £75-80K |
0.17% |
0.57% |
29.77 |
|
| £80-85K |
0.13% |
0.46% |
27.38 |
|
| £85-90K |
0.09% |
0.37% |
25.26 |
|
| £90-95K |
0.07% |
0.31% |
23.37 |
|
| £95-100K |
0.05% |
0.25% |
21.68 |
|
| £100K + |
0.20% |
1.34% |
14.75 |
|
|
|

|


|
1992-1997
|
1997-2001
|
|
|
|
| Con |
-10.54% |
| Lab |
4.23% |
| LD |
-1.91% |
| PC |
6.72% |
|
| Con |
2.85% |
| Lab |
-0.37% |
| LD |
1.89% |
|
|
 |
Elfyn Llwyd
Plaid Cymru hold
|
| Con |
 |
3,962 |
18.81% |
| Lab |
 |
4,775 |
22.66% |
| LD |
 |
1,872 |
8.89% |
| PC |
 |
10,459 |
49.64% |
| Oth |
|
0 |
0.00% |
| Maj |
 |
5,684 |
26.98% |
| Turn |
 |
21,068 |
63.51% |
|
|
 |
Elfyn Llwyd
Plaid Cymru hold
|
| C |
Lisa Francis |
3,962 |
18.81% |
| L |
Denise Jones |
4,775 |
22.66% |
| PC |
Elfyn Llwyd |
10,459 |
49.64% |
| LD |
Dafydd Raw-Rees |
1,872 |
8.89% |
|
Candidates representing 4 parties stood for election to this seat.
|
|
 |
Elfyn Llwyd
Plaid Cymru
|
| Con |
 |
3,922 |
15.96% |
| Lab |
 |
5,660 |
23.03% |
| LD |
 |
1,719 |
6.99% |
| PC |
 |
12,465 |
50.72% |
| Ref |
 |
809 |
3.29% |
| Oth |
|
0 |
0.00% |
| Maj |
 |
6,805 |
27.69% |
| Turn |
 |
24,575 |
75.98% |
|
|
 |
|
Plaid Cymru
|
| Con |
 |
6,995 |
26.50% |
| Lab |
 |
4,978 |
18.80% |
| LD |
 |
2,358 |
8.90% |
| PC |
 |
11,608 |
44.00% |
| Oth |
 |
471 |
1.80% |
| Maj |
 |
4,613 |
17.50% |
| Turn |
 |
26,410 |
80.36% |
|
|
 |
|

|

