|
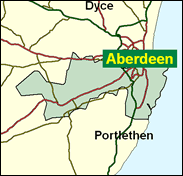
Aberdeen South
Labour hold

The Liberal Democrats reaped the reward for their consistent support of devolution in Scotland in 1999, when they entered a coalition government after returning 11 members of the Scottish Parliament, two more than they sent to Westminster in 1997. One of these "gains" was due to the splitting into two of their long-term Orkney and Shetland stronghold, but the other came in Aberdeen South, where the former (1991-2) MP for Kincardine and Deeside Nicol Stephen beat the Labour candidate in the single-member seat by 33pc to 28pc, with the Tories slipping to a poor third. It looks as if this will form one of the few Labour-LD marginals in the whole of Britain at the next general election. Nor should the Conservatives be permanently written off: the constituency contains some middle class areas in south Aberdeen and inland along the Dee. The Liberal Democrats are not expected to make net gains in the June 2001 general election, but the hard evidence is that if they pull off only one fresh triumph, this will be it: that would almost certainly be the first change of hands in the alphabetical order of seats, but scarcely a typical gain.

Anne Begg, a former teacher, born in 1955 and educated at Brechin High School and Aberdeen University, was elected in 1997. Toothy, small and wheelchair-bound as a victim of a degenerative brittle bone disease, she angered other disabled people by advising them to work rather than rely on benefits (though later campaigned for embryonic stem cell research into degenerative diseases), before spending a year as a Blairite on Labourís NEC. She faces a strong challenge not from the Tories, but from the Lib Dems in the shape of their leading Scottish activist Ian Yuill, a local councillor since 1995, locally born (1964), bred and educated (at Robert Gordonís College and Robert Gordonís Institute of Technology) and Convenor of the Scottish Liberal Democrats since 1999. He could give Labour a fright in his partyís number one target seat in Scotland, in a local campaign that will run counter to the grain of national Lab-Lib anti-Tory tactical voting.

 |
| Wealthy Achievers, Suburban Areas |
21.14% |
14.99% |
140.99 |
|
| Affluent Greys, Rural Communities |
0.01% |
2.13% |
0.44 |
|
| Prosperous Pensioners, Retirement Areas |
1.09% |
2.49% |
43.76 |
|
| Affluent Executives, Family Areas |
4.04% |
4.43% |
91.23 |
|
| Well-Off Workers, Family Areas |
3.54% |
7.27% |
48.62 |
|
| Affluent Urbanites, Town & City Areas |
9.14% |
2.56% |
356.47 |
|
| Prosperous Professionals, Metropolitan Areas |
5.60% |
2.04% |
274.57 |
|
| Better-Off Executives, Inner City Areas |
13.64% |
3.94% |
345.82 |
|
| Comfortable Middle Agers, Mature Home Owning Areas |
8.51% |
13.04% |
65.27 |
|
| Skilled Workers, Home Owning Areas |
3.29% |
12.70% |
25.92 |
|
| New Home Owners, Mature Communities |
5.84% |
8.14% |
71.77 |
|
| White Collar Workers, Better-Off Multi Ethnic Areas |
0.32% |
4.02% |
7.95 |
|
| Older People, Less Prosperous Areas |
2.62% |
3.19% |
82.20 |
|
| Council Estate Residents, Better-Off Homes |
12.48% |
11.31% |
110.33 |
|
| Council Estate Residents, High Unemployment |
6.29% |
3.06% |
205.54 |
|
| Council Estate Residents, Greatest Hardship |
2.45% |
2.52% |
97.17 |
|
| People in Multi-Ethnic, Low-Income Areas |
0.00% |
2.10% |
0.00 |
|
| Unclassified |
0.00% |
0.06% |
0.00 |
|
|
 |
|
|
| £0-5K |
6.87% |
9.41% |
72.97 |
|
| £5-10K |
13.33% |
16.63% |
80.13 |
|
| £10-15K |
14.58% |
16.58% |
87.94 |
|
| £15-20K |
13.03% |
13.58% |
95.91 |
|
| £20-25K |
10.75% |
10.39% |
103.40 |
|
| £25-30K |
8.56% |
7.77% |
110.12 |
|
| £30-35K |
6.72% |
5.79% |
116.02 |
|
| £35-40K |
5.25% |
4.33% |
121.16 |
|
| £40-45K |
4.10% |
3.27% |
125.66 |
|
| £45-50K |
3.22% |
2.48% |
129.61 |
|
| £50-55K |
2.54% |
1.90% |
133.11 |
|
| £55-60K |
2.01% |
1.47% |
136.24 |
|
| £60-65K |
1.60% |
1.15% |
139.06 |
|
| £65-70K |
1.28% |
0.91% |
141.61 |
|
| £70-75K |
1.04% |
0.72% |
143.93 |
|
| £75-80K |
0.84% |
0.57% |
146.04 |
|
| £80-85K |
0.68% |
0.46% |
147.96 |
|
| £85-90K |
0.56% |
0.37% |
149.72 |
|
| £90-95K |
0.46% |
0.31% |
151.33 |
|
| £95-100K |
0.38% |
0.25% |
152.79 |
|
| £100K + |
2.13% |
1.34% |
158.43 |
|
|
|
|


|
1992-1997
|
1997-2001
|
|
|
|
| Con |
-11.03% |
| Lab |
11.37% |
| LD |
0.93% |
| SNP |
-2.34% |
|
| Con |
-7.13% |
| Lab |
4.57% |
| LD |
0.31% |
| SNP |
1.88% |
|
|
|
Anne Begg
Labour hold
|
| Con |
 |
7,098 |
19.24% |
| Lab |
 |
14,696 |
39.84% |
| LD |
 |
10,308 |
27.94% |
| SNP |
 |
4,293 |
11.64% |
| Oth |
 |
495 |
1.34% |
| Maj |
 |
4,388 |
11.89% |
| Turn |
|
36,890 |
62.62% |
|
|
|
Anne Begg
Labour hold
|
| SNP |
Ian Angus |
4,293 |
11.64% |
| L |
Anne Begg |
14,696 |
39.84% |
| C |
Moray Macdonald |
7,098 |
19.24% |
| SSP |
David Watt |
495 |
1.34% |
| LD |
Ian Yuill |
10,308 |
27.94% |
|
Candidates representing 5 parties stood for election to this seat.
|
|
|
Anne Begg
Labour gain
|
| Con |
|
11,621 |
26.37% |
| Lab |
|
15,541 |
35.27% |
| LD |
|
12,176 |
27.63% |
| SNP |
|
4,299 |
9.76% |
| Ref |
 |
425 |
0.96% |
| Oth |
|
0 |
0.00% |
| Maj |
|
3,365 |
7.64% |
| Turn |
|
44,062 |
72.84% |
|
|
|
|
Conservative
|
| Con |
|
16,487 |
37.40% |
| Lab |
|
10,545 |
23.90% |
| LD |
|
11,762 |
26.70% |
| SNP |
|
5,336 |
12.10% |
| Oth |
|
0 |
0.00% |
| Maj |
|
4,725 |
10.70% |
| Turn |
|
44,130 |
73.12% |
|
|
|
|
|