|
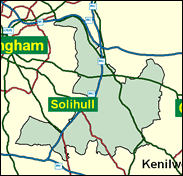
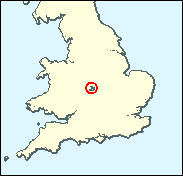
Meriden
Conservative hold

In the 2000 Solihull Borough elections in the West Midlands, the Conservatives heavily outpolled Labour in the wards making up the Meriden seat, which Caroline Spelman won by only 582 in the 1997 landslide. This was assisted by the fact that turnout in the Tory areas like Knowle, Castle Bromwich and Meriden itself was at least twice that in the Labour stronghold, the Chelmsley Wood estate, where it plummeted to a lamentable 15pc. This good Tory result was in a good region for the Conservatives in a relatively good year, but Labour will need to get their vote out even to approach a close contest in the next general election.

Caroline Spelman, a persuasive, personable former spokesman for European beet-growers, was elected in 1997, and swiftly became a Whip and then by 1999 a Health spokesman. Born 1958, educated at Hertfordshire & Essex Girls’ Grammar School and Queen Mary College London, she was director of her family’s food and biotechnology company. As one of only 5 new Tory women MPs in 1997, and one of only 14 altogether, she joined the Central Office team in 2000 to promote more women candidates, but with scant success given the mere nine women selected in the 75 most winnable Labour and Liberal Democrat seats. Labour's Christine Shawcroft is one of the few conspicuously non-Blairite candidates among the party's clutch of prospective new MPs in seats gained from the Conservatives. On the NEC as a member of the Left-wing Grassroots Alliance, she served for 13 years as a Tower Hamlets councillor and wants 'a much more radical second term'. Millbank will be happy to let the Tories keep Meriden.
 |
| Wealthy Achievers, Suburban Areas |
32.10% |
14.99% |
214.13 |
|
| Affluent Greys, Rural Communities |
0.00% |
2.13% |
0.00 |
|
| Prosperous Pensioners, Retirement Areas |
1.09% |
2.49% |
43.79 |
|
| Affluent Executives, Family Areas |
5.31% |
4.43% |
119.98 |
|
| Well-Off Workers, Family Areas |
6.86% |
7.27% |
94.29 |
|
| Affluent Urbanites, Town & City Areas |
0.25% |
2.56% |
9.76 |
|
| Prosperous Professionals, Metropolitan Areas |
0.00% |
2.04% |
0.00 |
|
| Better-Off Executives, Inner City Areas |
0.28% |
3.94% |
7.15 |
|
| Comfortable Middle Agers, Mature Home Owning Areas |
11.46% |
13.04% |
87.87 |
|
| Skilled Workers, Home Owning Areas |
2.71% |
12.70% |
21.31 |
|
| New Home Owners, Mature Communities |
3.24% |
8.14% |
39.73 |
|
| White Collar Workers, Better-Off Multi Ethnic Areas |
0.15% |
4.02% |
3.82 |
|
| Older People, Less Prosperous Areas |
0.63% |
3.19% |
19.93 |
|
| Council Estate Residents, Better-Off Homes |
30.69% |
11.31% |
271.35 |
|
| Council Estate Residents, High Unemployment |
2.52% |
3.06% |
82.23 |
|
| Council Estate Residents, Greatest Hardship |
2.71% |
2.52% |
107.52 |
|
| People in Multi-Ethnic, Low-Income Areas |
0.00% |
2.10% |
0.00 |
|
| Unclassified |
0.00% |
0.06% |
1.54 |
|
|
 |
|
|
| £0-5K |
8.81% |
9.41% |
93.63 |
|
| £5-10K |
15.58% |
16.63% |
93.68 |
|
| £10-15K |
15.50% |
16.58% |
93.52 |
|
| £15-20K |
12.82% |
13.58% |
94.38 |
|
| £20-25K |
10.00% |
10.39% |
96.22 |
|
| £25-30K |
7.68% |
7.77% |
98.79 |
|
| £30-35K |
5.90% |
5.79% |
101.85 |
|
| £35-40K |
4.56% |
4.33% |
105.18 |
|
| £40-45K |
3.55% |
3.27% |
108.64 |
|
| £45-50K |
2.78% |
2.48% |
112.09 |
|
| £50-55K |
2.20% |
1.90% |
115.46 |
|
| £55-60K |
1.75% |
1.47% |
118.69 |
|
| £60-65K |
1.40% |
1.15% |
121.73 |
|
| £65-70K |
1.13% |
0.91% |
124.58 |
|
| £70-75K |
0.91% |
0.72% |
127.21 |
|
| £75-80K |
0.75% |
0.57% |
129.62 |
|
| £80-85K |
0.61% |
0.46% |
131.82 |
|
| £85-90K |
0.50% |
0.37% |
133.82 |
|
| £90-95K |
0.41% |
0.31% |
135.62 |
|
| £95-100K |
0.34% |
0.25% |
137.24 |
|
| £100K + |
1.92% |
1.34% |
142.53 |
|
|
|
|


|
1992-1997
|
1997-2001
|
|
|
|
| Con |
-13.07% |
| Lab |
10.06% |
| LD |
-1.03% |
|
| Con |
5.65% |
| Lab |
-1.78% |
| LD |
-1.88% |
|
|
|
Caroline Spelman
Conservative hold
|
| Con |
 |
21,246 |
47.68% |
| Lab |
 |
17,462 |
39.19% |
| LD |
 |
4,941 |
11.09% |
| Oth |
 |
910 |
2.04% |
| Maj |
 |
3,784 |
8.49% |
| Turn |
|
44,559 |
59.00% |
|
|
|
Caroline Spelman
Conservative hold
|
| UK |
Richard Adams |
910 |
2.04% |
| LD |
Nigel Hicks |
4,941 |
11.09% |
| L |
Christine Shawcroft |
17,462 |
39.19% |
| C |
Caroline Spelman |
21,246 |
47.68% |
|
Candidates representing 4 parties stood for election to this seat.
|
|
|
Caroline Spelman
Conservative
|
| Con |
|
22,997 |
42.03% |
| Lab |
|
22,415 |
40.96% |
| LD |
|
7,098 |
12.97% |
| Ref |
 |
2,208 |
4.04% |
| Oth |
|
0 |
0.00% |
| Maj |
|
582 |
1.06% |
| Turn |
|
54,718 |
71.73% |
|
|
|
|
Conservative
|
| Con |
|
33,462 |
55.10% |
| Lab |
|
18,763 |
30.90% |
| LD |
|
8,489 |
14.00% |
| Oth |
|
0 |
0.00% |
| Maj |
|
14,699 |
24.20% |
| Turn |
|
60,714 |
77.42% |
|
|
|
|
|