|
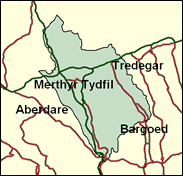
Merthyr Tydfil & Rhymney
Labour hold

The first great boom town of the Industrial Revolution in the South Wales valleys, and one of the leading coal and iron producing towns in the world in the early nineteenth Century, Merthyr Tydfil turned to Labour very early (Keir Hardie, the first Labour parliamentary leader, sat here from 1900 till his death in 1915), and has never abandoned that tradition, although the octogenarian sitting MP S.O.Davies won as an independent in 1970 after being deselected on grounds of age; that scarcely counts as negating old loyalties, and Ted Rowlands, who won the by-election caused by Davies's demise in 1972 is still here, having notched up a majority of over 27,000, Labour's fourth safest anywhere, in 1997.

Dai Havard, fringe-bearded Welsh secretary of the MSF Union, is Labour's replacement for Ted Rowlands, in a seat that has seen only two MPs in 64 years. He is local boy, born in 1950 at the bottom end of Merthyr Vale, at Quaker's Yard, into a family that switched from attended local secondary modern, grammar-technical and high schools and - eventually - Warwick University. Previously working in "jobbing maintenance" and with various unions, as MSF's head man in Wales, he pioneered postal balloting of his union members to give greater legitimacy to the Welsh Assembly Labour leadership election.
 |
| Wealthy Achievers, Suburban Areas |
2.11% |
14.99% |
14.10 |
|
| Affluent Greys, Rural Communities |
0.06% |
2.13% |
2.79 |
|
| Prosperous Pensioners, Retirement Areas |
0.00% |
2.49% |
0.00 |
|
| Affluent Executives, Family Areas |
1.54% |
4.43% |
34.87 |
|
| Well-Off Workers, Family Areas |
2.75% |
7.27% |
37.75 |
|
| Affluent Urbanites, Town & City Areas |
0.00% |
2.56% |
0.00 |
|
| Prosperous Professionals, Metropolitan Areas |
0.00% |
2.04% |
0.00 |
|
| Better-Off Executives, Inner City Areas |
0.00% |
3.94% |
0.00 |
|
| Comfortable Middle Agers, Mature Home Owning Areas |
3.80% |
13.04% |
29.18 |
|
| Skilled Workers, Home Owning Areas |
46.23% |
12.70% |
363.95 |
|
| New Home Owners, Mature Communities |
10.18% |
8.14% |
124.95 |
|
| White Collar Workers, Better-Off Multi Ethnic Areas |
0.03% |
4.02% |
0.65 |
|
| Older People, Less Prosperous Areas |
2.80% |
3.19% |
87.79 |
|
| Council Estate Residents, Better-Off Homes |
23.49% |
11.31% |
207.72 |
|
| Council Estate Residents, High Unemployment |
1.39% |
3.06% |
45.44 |
|
| Council Estate Residents, Greatest Hardship |
5.62% |
2.52% |
223.06 |
|
| People in Multi-Ethnic, Low-Income Areas |
0.00% |
2.10% |
0.00 |
|
| Unclassified |
0.00% |
0.06% |
0.00 |
|
|
 |
 |
 |
| £0-5K |
14.74% |
9.41% |
156.57 |
|
| £5-10K |
24.62% |
16.63% |
148.05 |
|
| £10-15K |
20.87% |
16.58% |
125.88 |
|
| £15-20K |
14.17% |
13.58% |
104.35 |
|
| £20-25K |
8.99% |
10.39% |
86.48 |
|
| £25-30K |
5.62% |
7.77% |
72.30 |
|
| £30-35K |
3.54% |
5.79% |
61.19 |
|
| £35-40K |
2.27% |
4.33% |
52.47 |
|
| £40-45K |
1.49% |
3.27% |
45.59 |
|
| £45-50K |
1.00% |
2.48% |
40.11 |
|
| £50-55K |
0.68% |
1.90% |
35.69 |
|
| £55-60K |
0.47% |
1.47% |
32.09 |
|
| £60-65K |
0.34% |
1.15% |
29.12 |
|
| £65-70K |
0.24% |
0.91% |
26.64 |
|
| £70-75K |
0.18% |
0.72% |
24.55 |
|
| £75-80K |
0.13% |
0.57% |
22.77 |
|
| £80-85K |
0.10% |
0.46% |
21.24 |
|
| £85-90K |
0.07% |
0.37% |
19.91 |
|
| £90-95K |
0.06% |
0.31% |
18.74 |
|
| £95-100K |
0.04% |
0.25% |
17.72 |
|
| £100K + |
0.18% |
1.34% |
13.51 |
|
|
|

|


|
1992-1997
|
1997-2001
|
|
|
|
| Con |
-4.69% |
| Lab |
5.08% |
| LD |
-3.82% |
| PC |
-0.11% |
|
| Con |
0.76% |
| Lab |
-14.90% |
| LD |
0.05% |
| PC |
8.69% |
|
|
 |
Dai Havard
Labour hold
|
| Con |
 |
2,272 |
7.17% |
| Lab |
 |
19,574 |
61.78% |
| LD |
 |
2,385 |
7.53% |
| PC |
 |
4,651 |
14.68% |
| Oth |
 |
2,802 |
8.84% |
| Maj |
 |
14,923 |
47.10% |
| Turn |
 |
31,684 |
57.22% |
|
|
 |
Dai Havard
Labour hold
|
| C |
Richard Cuming |
2,272 |
7.17% |
| I |
Jeff Edwards |
1,936 |
6.11% |
| SL |
Ken Evans |
692 |
2.18% |
| L |
Dai Havard |
19,574 |
61.78% |
| PC |
Robert Hughes |
4,651 |
14.68% |
| P |
Anthony Lewis |
174 |
0.55% |
| LD |
Keith Rogers |
2,385 |
7.53% |
|
Candidates representing 7 parties stood for election to this seat.
|
|
 |
Ted Rowlands
Labour
|
| Con |
 |
2,508 |
6.41% |
| Lab |
 |
30,012 |
76.68% |
| LD |
 |
2,926 |
7.48% |
| PC |
 |
2,344 |
5.99% |
| Ref |
 |
660 |
1.69% |
| Oth |
 |
691 |
1.77% |
| Maj |
 |
27,086 |
69.20% |
| Turn |
 |
39,141 |
69.27% |
|
|
 |
|
Labour
|
| Con |
 |
4,904 |
11.10% |
| Lab |
 |
31,710 |
71.60% |
| LD |
 |
4,997 |
11.30% |
| PC |
 |
2,704 |
6.10% |
| Oth |
|
0 |
0.00% |
| Maj |
 |
26,713 |
60.30% |
| Turn |
 |
44,315 |
75.19% |
|
|
 |
|

|

