|
Middlesbrough South & East Cleveland
Labour hold

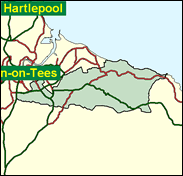
Although his representation of this area, formerly called Langbaurgh, has been in and out and in again, Labour's Ashok Kumar should finally achieve two in a row in defending a 10,000 majority achieved in 1997. As the Conservative victories in 1987 and 1992 indicate, this area is mixed, with the Tory strength to be found in both sectors. Outside Middlesbrough in the seaside resort of Saltburn, for example, and within it in middle class suburbs such as Marton, Nunthorpe and on the new private estates of Newham ward. Labour fights back in the Middlesbrough council estates of Park End and Easterside and in towns like Loftus and Skinningrove.

Dr. Ashok Kumar, one of Labour’s 10 non-white MPs (but in his case in a 99pc white seat), an agnostic of Sikh origin, was born in Uttar Pradesh, India, in 1956, and educated at Rykneld School, Derby and Aston University, where he obtained a doctorate in fluid dynamics. A research scientist at British Steel before winning a by-election here in 1991 (and losing in 1992), he now has to fight off contraction of the local CORUS-run steel works. Round-faced and pleasant-looking, he is one of many to have made the transition from the soft left orthodoxies of the 1980s to the modernising Blairite nostrums of the 1990s.
 |
| Wealthy Achievers, Suburban Areas |
12.14% |
14.99% |
80.96 |
|
| Affluent Greys, Rural Communities |
0.20% |
2.13% |
9.26 |
|
| Prosperous Pensioners, Retirement Areas |
1.20% |
2.49% |
48.18 |
|
| Affluent Executives, Family Areas |
10.24% |
4.43% |
231.45 |
|
| Well-Off Workers, Family Areas |
14.82% |
7.27% |
203.75 |
|
| Affluent Urbanites, Town & City Areas |
0.88% |
2.56% |
34.15 |
|
| Prosperous Professionals, Metropolitan Areas |
0.01% |
2.04% |
0.31 |
|
| Better-Off Executives, Inner City Areas |
1.71% |
3.94% |
43.38 |
|
| Comfortable Middle Agers, Mature Home Owning Areas |
8.05% |
13.04% |
61.75 |
|
| Skilled Workers, Home Owning Areas |
12.55% |
12.70% |
98.79 |
|
| New Home Owners, Mature Communities |
7.47% |
8.14% |
91.71 |
|
| White Collar Workers, Better-Off Multi Ethnic Areas |
1.56% |
4.02% |
38.81 |
|
| Older People, Less Prosperous Areas |
3.50% |
3.19% |
109.83 |
|
| Council Estate Residents, Better-Off Homes |
18.71% |
11.31% |
165.45 |
|
| Council Estate Residents, High Unemployment |
1.13% |
3.06% |
36.78 |
|
| Council Estate Residents, Greatest Hardship |
5.84% |
2.52% |
232.00 |
|
| People in Multi-Ethnic, Low-Income Areas |
0.00% |
2.10% |
0.00 |
|
| Unclassified |
0.00% |
0.06% |
0.00 |
|
|
 |
 |
 |
| £0-5K |
11.17% |
9.41% |
118.65 |
|
| £5-10K |
18.35% |
16.63% |
110.34 |
|
| £10-15K |
17.38% |
16.58% |
104.84 |
|
| £15-20K |
13.74% |
13.58% |
101.18 |
|
| £20-25K |
10.22% |
10.39% |
98.33 |
|
| £25-30K |
7.45% |
7.77% |
95.79 |
|
| £30-35K |
5.41% |
5.79% |
93.36 |
|
| £35-40K |
3.94% |
4.33% |
90.98 |
|
| £40-45K |
2.89% |
3.27% |
88.65 |
|
| £45-50K |
2.14% |
2.48% |
86.38 |
|
| £50-55K |
1.60% |
1.90% |
84.19 |
|
| £55-60K |
1.21% |
1.47% |
82.09 |
|
| £60-65K |
0.92% |
1.15% |
80.08 |
|
| £65-70K |
0.71% |
0.91% |
78.18 |
|
| £70-75K |
0.55% |
0.72% |
76.37 |
|
| £75-80K |
0.43% |
0.57% |
74.67 |
|
| £80-85K |
0.34% |
0.46% |
73.06 |
|
| £85-90K |
0.27% |
0.37% |
71.54 |
|
| £90-95K |
0.21% |
0.31% |
70.10 |
|
| £95-100K |
0.17% |
0.25% |
68.75 |
|
| £100K + |
0.83% |
1.34% |
61.79 |
|
|
|

|


|
1992-1997
|
1997-2001
|
|
|
|
| Con |
-10.88% |
| Lab |
11.41% |
| LD |
-3.43% |
|
| Con |
-0.89% |
| Lab |
0.57% |
| LD |
3.21% |
|
|
 |
Ashok Kumar
Labour hold
|
| Con |
 |
14,970 |
34.03% |
| Lab |
 |
24,321 |
55.29% |
| LD |
 |
4,700 |
10.68% |
| Oth |
|
0 |
0.00% |
| Maj |
 |
9,351 |
21.26% |
| Turn |
 |
43,991 |
61.54% |
|
|
 |
Ashok Kumar
Labour hold
|
| C |
Barbara Harpham |
14,970 |
34.03% |
| L |
Ashok Kumar |
24,321 |
55.29% |
| LD |
Linda Parrish |
4,700 |
10.68% |
|
Candidates representing 3 parties stood for election to this seat.
|
|
 |
Ashok Kumar
Labour gain
|
| Con |
 |
18,712 |
34.92% |
| Lab |
 |
29,319 |
54.71% |
| LD |
 |
4,004 |
7.47% |
| Ref |
 |
1,552 |
2.90% |
| Oth |
|
0 |
0.00% |
| Maj |
 |
10,607 |
19.79% |
| Turn |
 |
53,587 |
76.03% |
|
|
 |
|
Conservative
|
| Con |
 |
25,802 |
45.80% |
| Lab |
 |
24,401 |
43.30% |
| LD |
 |
6,163 |
10.90% |
| Oth |
|
0 |
0.00% |
| Maj |
 |
1,401 |
2.50% |
| Turn |
 |
56,366 |
80.71% |
|
|
 |
|

|

