|
Midlothian
Labour hold

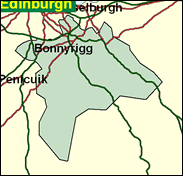
Not the whole of the county which historically contained Edinburgh, of course, but a chain of homogeneous working class ex-mining communities south of the capital, such as Loanhead, Bonnyrigg, Lasswade, Dalkeith, Gorebridge, and Newtongrange. The electorate is less than 49,000, which can scarcely be justified when the UK average is over 20,000 higher, and it is indeed the plan to reduce the Scottish representation to equality with the English, although that will also reduce the phalanx of Scottish Labour MPs. The issue of whether Scottish MPs at Westminster should be able to express a vote and influence on non-Scottish matters even then remains open - but that question is associated more with West Lothian than Midlothian.

In replacing retiring miner Eric Clarke, Labour has come up - unbelievably - with another miner, notwithstanding the ending of the local mining industry with the closure of Monktonhall Colliery in 1997. Born 1950, and educated at Dalkeith High School, David Hamilton was a miner for 20 years until being unfairly dismissed during the 1984/5 strike, when he was Co-ordinating Chairman of 22 strike centres involving 3,500 miners in the Lothian coalfield. A local councillor since 1995, he has worked latterly in voluntary sector jobs involving the raising of EU funding for Midlothian, and the renovation of local council houses. His cv resonates here, if not in Islington.
 |
| Wealthy Achievers, Suburban Areas |
8.16% |
14.99% |
54.45 |
|
| Affluent Greys, Rural Communities |
0.21% |
2.13% |
9.69 |
|
| Prosperous Pensioners, Retirement Areas |
0.18% |
2.49% |
7.28 |
|
| Affluent Executives, Family Areas |
2.38% |
4.43% |
53.68 |
|
| Well-Off Workers, Family Areas |
10.84% |
7.27% |
149.09 |
|
| Affluent Urbanites, Town & City Areas |
2.81% |
2.56% |
109.55 |
|
| Prosperous Professionals, Metropolitan Areas |
0.05% |
2.04% |
2.22 |
|
| Better-Off Executives, Inner City Areas |
0.64% |
3.94% |
16.15 |
|
| Comfortable Middle Agers, Mature Home Owning Areas |
4.14% |
13.04% |
31.75 |
|
| Skilled Workers, Home Owning Areas |
6.25% |
12.70% |
49.22 |
|
| New Home Owners, Mature Communities |
17.85% |
8.14% |
219.25 |
|
| White Collar Workers, Better-Off Multi Ethnic Areas |
0.43% |
4.02% |
10.63 |
|
| Older People, Less Prosperous Areas |
5.29% |
3.19% |
166.01 |
|
| Council Estate Residents, Better-Off Homes |
33.30% |
11.31% |
294.41 |
|
| Council Estate Residents, High Unemployment |
4.70% |
3.06% |
153.42 |
|
| Council Estate Residents, Greatest Hardship |
2.78% |
2.52% |
110.25 |
|
| People in Multi-Ethnic, Low-Income Areas |
0.00% |
2.10% |
0.00 |
|
| Unclassified |
0.00% |
0.06% |
0.00 |
|
|
 |
 |
 |
| £0-5K |
8.95% |
9.41% |
95.07 |
|
| £5-10K |
17.23% |
16.63% |
103.59 |
|
| £10-15K |
17.67% |
16.58% |
106.59 |
|
| £15-20K |
14.51% |
13.58% |
106.79 |
|
| £20-25K |
10.95% |
10.39% |
105.39 |
|
| £25-30K |
8.01% |
7.77% |
103.07 |
|
| £30-35K |
5.81% |
5.79% |
100.25 |
|
| £35-40K |
4.21% |
4.33% |
97.16 |
|
| £40-45K |
3.07% |
3.27% |
93.98 |
|
| £45-50K |
2.25% |
2.48% |
90.78 |
|
| £50-55K |
1.67% |
1.90% |
87.64 |
|
| £55-60K |
1.25% |
1.47% |
84.60 |
|
| £60-65K |
0.94% |
1.15% |
81.66 |
|
| £65-70K |
0.71% |
0.91% |
78.86 |
|
| £70-75K |
0.55% |
0.72% |
76.18 |
|
| £75-80K |
0.42% |
0.57% |
73.63 |
|
| £80-85K |
0.33% |
0.46% |
71.21 |
|
| £85-90K |
0.26% |
0.37% |
68.91 |
|
| £90-95K |
0.20% |
0.31% |
66.73 |
|
| £95-100K |
0.16% |
0.25% |
64.66 |
|
| £100K + |
0.72% |
1.34% |
53.69 |
|
|
|

|


|
1992-1997
|
1997-2001
|
|
|
|
| Con |
-6.70% |
| Lab |
5.31% |
| LD |
-0.82% |
| SNP |
2.31% |
|
| Con |
-1.33% |
| Lab |
-0.78% |
| LD |
3.65% |
| SNP |
-4.16% |
|
|
 |
David Hamilton
Labour hold
|
| Con |
 |
2,748 |
9.57% |
| Lab |
 |
15,145 |
52.73% |
| LD |
 |
3,686 |
12.83% |
| SNP |
 |
6,131 |
21.34% |
| Oth |
 |
1,014 |
3.53% |
| Maj |
 |
9,014 |
31.38% |
| Turn |
 |
28,724 |
59.07% |
|
|
 |
David Hamilton
Labour hold
|
| LD |
Jacqueline Bell |
3,686 |
12.83% |
| SNP |
Ian Goldie |
6,131 |
21.34% |
| SSP |
Bob Goupillot |
837 |
2.91% |
| L |
David Hamilton |
15,145 |
52.73% |
| P |
Terence Holden |
177 |
0.62% |
| C |
Robin Traquir |
2,748 |
9.57% |
|
Candidates representing 6 parties stood for election to this seat.
|
|
 |
Eric Clarke
Labour
|
| Con |
 |
3,842 |
10.90% |
| Lab |
 |
18,861 |
53.51% |
| LD |
 |
3,235 |
9.18% |
| SNP |
 |
8,991 |
25.51% |
| Ref |
 |
320 |
0.91% |
| Oth |
|
0 |
0.00% |
| Maj |
 |
9,870 |
28.00% |
| Turn |
 |
35,249 |
74.13% |
|
|
 |
|
Labour
|
| Con |
 |
6,242 |
17.60% |
| Lab |
 |
17,120 |
48.20% |
| LD |
 |
3,552 |
10.00% |
| SNP |
 |
8,256 |
23.20% |
| Oth |
 |
377 |
1.10% |
| Maj |
 |
8,864 |
24.90% |
| Turn |
 |
35,547 |
74.13% |
|
|
 |
|

|

