|
Milton Keynes North East
Labour hold

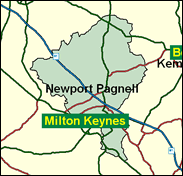
The more marginal of the two Milton Keynes seats, recent local election evidence is distorted by two factors. Milton Keynes is now a unitary authority rather than a borough within and under Buckinghamshire County Council, and has been re-warded since the Boundary Commission created the seat in a rare extraordinary boundary review in 1989. Also, the Liberal Democrats still do very well in local elections, while the seat was a photo-finish between the two larger parties in 1997, Brian White coming out on top for Labour by 240. There is little indication that the swing will be much different from the national average, so a Conservative regain is likely, although this would scarcely shift the national balance of power; in the Euro-elections of June 1999 the Tories were 12pc ahead, far from their best showing among their "easiest" targets.

Brian White, a beaky-nosed, bearded, cadaverous Ulsterman, is a computer man with a constituency interest in defending the printing of Acts of Parliament on vellum, because the only printing works doing that job is in his patch. Born 1957, and educated at Methodist College, Belfast, his cv is all ‘information technology’. He should, if any seats change hands, be beaten by the Conservative Marion Rix, the most likely new Tory woman MP and a partner in a Norfolk farming business. Born 1959, she attended Sherwood Hall Girls’ Grammar School, Nottinghamshire and Reading University, has a teaching qualification and has worked as a schools’ librarian for 3 years and as company secretary of a meat production and marketing company. A Norfolk County Councillor since 1997 in Gillian Shepherd’s patch, she is one of her party’s favoured would-be women MPs - having been runner-up for the nomination both in NW Norfolk and Eddisbury.
 |
| Wealthy Achievers, Suburban Areas |
19.99% |
14.99% |
133.32 |
|
| Affluent Greys, Rural Communities |
0.07% |
2.13% |
3.35 |
|
| Prosperous Pensioners, Retirement Areas |
0.00% |
2.49% |
0.00 |
|
| Affluent Executives, Family Areas |
24.28% |
4.43% |
548.67 |
|
| Well-Off Workers, Family Areas |
16.80% |
7.27% |
230.97 |
|
| Affluent Urbanites, Town & City Areas |
4.31% |
2.56% |
167.94 |
|
| Prosperous Professionals, Metropolitan Areas |
0.00% |
2.04% |
0.00 |
|
| Better-Off Executives, Inner City Areas |
1.02% |
3.94% |
25.95 |
|
| Comfortable Middle Agers, Mature Home Owning Areas |
4.39% |
13.04% |
33.67 |
|
| Skilled Workers, Home Owning Areas |
6.81% |
12.70% |
53.64 |
|
| New Home Owners, Mature Communities |
3.86% |
8.14% |
47.45 |
|
| White Collar Workers, Better-Off Multi Ethnic Areas |
0.34% |
4.02% |
8.53 |
|
| Older People, Less Prosperous Areas |
0.87% |
3.19% |
27.24 |
|
| Council Estate Residents, Better-Off Homes |
16.09% |
11.31% |
142.26 |
|
| Council Estate Residents, High Unemployment |
0.00% |
3.06% |
0.00 |
|
| Council Estate Residents, Greatest Hardship |
1.16% |
2.52% |
46.00 |
|
| People in Multi-Ethnic, Low-Income Areas |
0.00% |
2.10% |
0.00 |
|
| Unclassified |
0.00% |
0.06% |
0.00 |
|
|
 |
 |
 |
| £0-5K |
5.44% |
9.41% |
57.77 |
|
| £5-10K |
11.50% |
16.63% |
69.13 |
|
| £10-15K |
13.61% |
16.58% |
82.08 |
|
| £15-20K |
12.85% |
13.58% |
94.63 |
|
| £20-25K |
11.02% |
10.39% |
106.04 |
|
| £25-30K |
9.03% |
7.77% |
116.10 |
|
| £30-35K |
7.23% |
5.79% |
124.82 |
|
| £35-40K |
5.73% |
4.33% |
132.28 |
|
| £40-45K |
4.53% |
3.27% |
138.63 |
|
| £45-50K |
3.57% |
2.48% |
143.99 |
|
| £50-55K |
2.83% |
1.90% |
148.49 |
|
| £55-60K |
2.24% |
1.47% |
152.27 |
|
| £60-65K |
1.79% |
1.15% |
155.41 |
|
| £65-70K |
1.43% |
0.91% |
158.02 |
|
| £70-75K |
1.15% |
0.72% |
160.18 |
|
| £75-80K |
0.93% |
0.57% |
161.94 |
|
| £80-85K |
0.76% |
0.46% |
163.37 |
|
| £85-90K |
0.62% |
0.37% |
164.51 |
|
| £90-95K |
0.50% |
0.31% |
165.41 |
|
| £95-100K |
0.42% |
0.25% |
166.10 |
|
| £100K + |
2.23% |
1.34% |
165.98 |
|
|
|

|


|
1992-1997
|
1997-2001
|
|
|
|
| Con |
-12.64% |
| Lab |
15.73% |
| LD |
-5.62% |
|
| Con |
-0.88% |
| Lab |
2.53% |
| LD |
0.40% |
|
|
 |
Brian White
Labour hold
|
| Con |
 |
17,932 |
38.08% |
| Lab |
 |
19,761 |
41.96% |
| LD |
 |
8,375 |
17.78% |
| Oth |
 |
1,026 |
2.18% |
| Maj |
 |
1,829 |
3.88% |
| Turn |
 |
47,094 |
62.35% |
|
|
 |
Brian White
Labour hold
|
| UK |
Michael Phillips |
1,026 |
2.18% |
| C |
Marion Rix |
17,932 |
38.08% |
| L |
Brian White |
19,761 |
41.96% |
| LD |
David Yeoward |
8,375 |
17.78% |
|
Candidates representing 4 parties stood for election to this seat.
|
|
 |
Brian White
Labour gain
|
| Con |
 |
19,961 |
38.96% |
| Lab |
 |
20,201 |
39.43% |
| LD |
 |
8,907 |
17.38% |
| Ref |
 |
1,492 |
2.91% |
| Oth |
 |
675 |
1.32% |
| Maj |
 |
240 |
0.47% |
| Turn |
 |
51,236 |
72.78% |
|
|
 |
|
Conservative
|
| Con |
 |
26,212 |
51.60% |
| Lab |
 |
12,036 |
23.70% |
| LD |
 |
11,693 |
23.00% |
| Oth |
 |
857 |
1.70% |
| Maj |
 |
14,176 |
27.90% |
| Turn |
 |
50,798 |
83.20% |
|
|
 |
|

|

