|
Milton Keynes South West
Labour hold

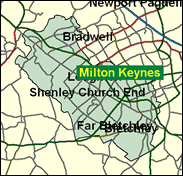
Milton Keynes swung even more to Labour than the national average in 1997, as might be expected in New City with few political traditional roots, but it should not be assumed that it will swing back as far next time; Phyllis Starkey seems assured of at least one more term in the Commons. This is clearly the more Labour half of the planned city; indeed, it includes several substantial older communities partly swallowed up in the new development, such as Bletchley, Fenny Stratford, Stony Stratford and Wolverton, the railway town which traditionally supplied the most Labour ward in the whole of Buckinghamshire (indeed the only one in their dark years such as the 1977 county council elections). Otherwise we are in concrete cow country, with the hypermodern architecture of the vast central shopping area, and such recent neighbourhoods as Coffee Hall in Woughton ward and Loughton Park, which is all private. This may not be the face of the future for all tastes, but for new Labour, at the moment it works.

Phyllis Starkey, one of Labour’s more academic women from the 1997 intake, is a staunch loyalist on everything where loyalty counts, notably defending the Government on television during the first big revolt against lone parent benefit cuts in 1997. A somewhat swivel-eyed, intense research scientist, born 1947 and educated cerebrally at Perse Girls’ School Cambridge, Lady Margaret Hall Oxford, and Clare College Cambridge, where she acquired a doctorate, she was - as former leader of Oxford City Council - among the most experienced of Labour’s municipal realists in the new intake. Her only original features are a staunchly anti-Zionist preference for the Palestinian cause, and a desire to regulate the night club bouncing profession.
 |
| Wealthy Achievers, Suburban Areas |
8.23% |
14.99% |
54.91 |
|
| Affluent Greys, Rural Communities |
0.00% |
2.13% |
0.00 |
|
| Prosperous Pensioners, Retirement Areas |
0.11% |
2.49% |
4.37 |
|
| Affluent Executives, Family Areas |
21.91% |
4.43% |
495.18 |
|
| Well-Off Workers, Family Areas |
16.50% |
7.27% |
226.78 |
|
| Affluent Urbanites, Town & City Areas |
2.09% |
2.56% |
81.30 |
|
| Prosperous Professionals, Metropolitan Areas |
0.00% |
2.04% |
0.00 |
|
| Better-Off Executives, Inner City Areas |
0.58% |
3.94% |
14.77 |
|
| Comfortable Middle Agers, Mature Home Owning Areas |
5.37% |
13.04% |
41.19 |
|
| Skilled Workers, Home Owning Areas |
12.97% |
12.70% |
102.13 |
|
| New Home Owners, Mature Communities |
7.66% |
8.14% |
94.05 |
|
| White Collar Workers, Better-Off Multi Ethnic Areas |
1.01% |
4.02% |
25.11 |
|
| Older People, Less Prosperous Areas |
1.44% |
3.19% |
45.14 |
|
| Council Estate Residents, Better-Off Homes |
13.68% |
11.31% |
120.94 |
|
| Council Estate Residents, High Unemployment |
0.28% |
3.06% |
9.12 |
|
| Council Estate Residents, Greatest Hardship |
8.08% |
2.52% |
320.97 |
|
| People in Multi-Ethnic, Low-Income Areas |
0.00% |
2.10% |
0.00 |
|
| Unclassified |
0.09% |
0.06% |
144.24 |
|
|
 |
 |
 |
| £0-5K |
7.16% |
9.41% |
76.05 |
|
| £5-10K |
13.97% |
16.63% |
83.97 |
|
| £10-15K |
15.33% |
16.58% |
92.48 |
|
| £15-20K |
13.57% |
13.58% |
99.89 |
|
| £20-25K |
10.99% |
10.39% |
105.77 |
|
| £25-30K |
8.57% |
7.77% |
110.21 |
|
| £30-35K |
6.57% |
5.79% |
113.45 |
|
| £35-40K |
5.01% |
4.33% |
115.74 |
|
| £40-45K |
3.83% |
3.27% |
117.28 |
|
| £45-50K |
2.94% |
2.48% |
118.26 |
|
| £50-55K |
2.26% |
1.90% |
118.81 |
|
| £55-60K |
1.75% |
1.47% |
119.04 |
|
| £60-65K |
1.37% |
1.15% |
119.01 |
|
| £65-70K |
1.08% |
0.91% |
118.80 |
|
| £70-75K |
0.85% |
0.72% |
118.44 |
|
| £75-80K |
0.68% |
0.57% |
117.98 |
|
| £80-85K |
0.54% |
0.46% |
117.44 |
|
| £85-90K |
0.44% |
0.37% |
116.84 |
|
| £90-95K |
0.35% |
0.31% |
116.19 |
|
| £95-100K |
0.29% |
0.25% |
115.52 |
|
| £100K + |
1.49% |
1.34% |
110.54 |
|
|
|

|


|
1992-1997
|
1997-2001
|
|
|
|
| Con |
-13.10% |
| Lab |
16.38% |
| LD |
-2.55% |
|
| Con |
0.66% |
| Lab |
-4.24% |
| LD |
-1.31% |
|
|
 |
Phyllis Starkey
Labour hold
|
| Con |
 |
15,506 |
34.17% |
| Lab |
 |
22,484 |
49.54% |
| LD |
 |
4,828 |
10.64% |
| Oth |
 |
2,566 |
5.65% |
| Maj |
 |
6,978 |
15.38% |
| Turn |
 |
45,384 |
59.24% |
|
|
 |
Phyllis Starkey
Labour hold
|
| SA |
Dave Bradbury |
261 |
0.58% |
| UK |
Clive Davies |
848 |
1.87% |
| LCA |
Patrick Denning |
500 |
1.10% |
| G |
Alan Francis |
957 |
2.11% |
| LD |
Nazar Mohammad |
4,828 |
10.64% |
| L |
Phyllis Starkey |
22,484 |
49.54% |
| C |
Iain Stewart |
15,506 |
34.17% |
|
Candidates representing 7 parties stood for election to this seat.
|
|
 |
Phyllis Starkey
Labour gain
|
| Con |
 |
17,006 |
33.50% |
| Lab |
 |
27,298 |
53.78% |
| LD |
 |
6,065 |
11.95% |
| Ref |
|
0 |
0.00% |
| Oth |
 |
389 |
0.77% |
| Maj |
 |
10,292 |
20.28% |
| Turn |
 |
50,758 |
71.42% |
|
|
 |
|
Conservative
|
| Con |
 |
23,840 |
46.60% |
| Lab |
 |
19,153 |
37.40% |
| LD |
 |
7,429 |
14.50% |
| Oth |
 |
727 |
1.40% |
| Maj |
 |
4,687 |
9.20% |
| Turn |
 |
51,149 |
77.75% |
|
|
 |
|

|

