|
Mitcham & Morden
Labour hold

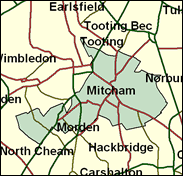
Greater London seems scarcely to have moved away from Labour at all since 1997, and certainly in the Merton Borough elections the next year they repeated Siobhain McDonagh's achievement of claiming twice the Tory vote in Mitcham and Morden. It is not beyond the bounds of possibility that this will happen for a third time in succession; it seems almost beyond those bounds that Labour might actually lose in their stronger half of what has become a strong borough, including unpretentious neighbourhoods like Phipps Bridge and part of the St. Helier estate shared with the Borough of Sutton, and Colliers Wood in the Wandle valley.

Siobhain McDonagh, elected here in 1997, performed her part in the Blairite revolution by savaging Arthur Scargill for his opposition to the Clause Four redraft. Born 1960 into an Irish Catholic family, and educated at Holy Cross Secondary Modern, Colliers Wood, and at Essex University, her sister Margaret is General Secretary of the Labour Party, and her parliamentary aide, David Cairns, about to be elected MP for Greenock, following her campaign to lift the ban on ex-RC priests sitting as MPs. A Merton councillor for 15 years but quiet in the House, she registers her on-message support in the press whether praising Alastair Campbell or damning Ken Livingstone for his negative impact on Labour’s support in London.
 |
| Wealthy Achievers, Suburban Areas |
0.00% |
14.99% |
0.00 |
|
| Affluent Greys, Rural Communities |
0.00% |
2.13% |
0.00 |
|
| Prosperous Pensioners, Retirement Areas |
0.07% |
2.49% |
2.69 |
|
| Affluent Executives, Family Areas |
0.15% |
4.43% |
3.33 |
|
| Well-Off Workers, Family Areas |
0.00% |
7.27% |
0.00 |
|
| Affluent Urbanites, Town & City Areas |
6.16% |
2.56% |
240.31 |
|
| Prosperous Professionals, Metropolitan Areas |
6.43% |
2.04% |
314.90 |
|
| Better-Off Executives, Inner City Areas |
1.21% |
3.94% |
30.72 |
|
| Comfortable Middle Agers, Mature Home Owning Areas |
5.80% |
13.04% |
44.48 |
|
| Skilled Workers, Home Owning Areas |
28.65% |
12.70% |
225.55 |
|
| New Home Owners, Mature Communities |
3.58% |
8.14% |
43.98 |
|
| White Collar Workers, Better-Off Multi Ethnic Areas |
26.09% |
4.02% |
648.65 |
|
| Older People, Less Prosperous Areas |
4.21% |
3.19% |
132.10 |
|
| Council Estate Residents, Better-Off Homes |
12.13% |
11.31% |
107.21 |
|
| Council Estate Residents, High Unemployment |
2.49% |
3.06% |
81.21 |
|
| Council Estate Residents, Greatest Hardship |
0.68% |
2.52% |
26.91 |
|
| People in Multi-Ethnic, Low-Income Areas |
2.37% |
2.10% |
112.70 |
|
| Unclassified |
0.00% |
0.06% |
0.00 |
|
|
 |
 |
 |
| £0-5K |
7.16% |
9.41% |
76.03 |
|
| £5-10K |
14.12% |
16.63% |
84.88 |
|
| £10-15K |
15.51% |
16.58% |
93.53 |
|
| £15-20K |
13.70% |
13.58% |
100.89 |
|
| £20-25K |
11.09% |
10.39% |
106.75 |
|
| £25-30K |
8.65% |
7.77% |
111.24 |
|
| £30-35K |
6.64% |
5.79% |
114.58 |
|
| £35-40K |
5.07% |
4.33% |
116.99 |
|
| £40-45K |
3.87% |
3.27% |
118.66 |
|
| £45-50K |
2.97% |
2.48% |
119.74 |
|
| £50-55K |
2.29% |
1.90% |
120.36 |
|
| £55-60K |
1.78% |
1.47% |
120.61 |
|
| £60-65K |
1.39% |
1.15% |
120.59 |
|
| £65-70K |
1.09% |
0.91% |
120.35 |
|
| £70-75K |
0.86% |
0.72% |
119.94 |
|
| £75-80K |
0.69% |
0.57% |
119.40 |
|
| £80-85K |
0.55% |
0.46% |
118.76 |
|
| £85-90K |
0.44% |
0.37% |
118.04 |
|
| £90-95K |
0.36% |
0.31% |
117.27 |
|
| £95-100K |
0.29% |
0.25% |
116.45 |
|
| £100K + |
1.48% |
1.34% |
110.20 |
|
|
|

|


|
1992-1997
|
1997-2001
|
|
|
|
| Con |
-16.79% |
| Lab |
15.27% |
| LD |
-1.62% |
|
| Con |
-5.60% |
| Lab |
2.05% |
| LD |
2.49% |
|
|
 |
Siobhain McDonagh
Labour hold
|
| Con |
 |
9,151 |
24.11% |
| Lab |
 |
22,936 |
60.42% |
| LD |
 |
3,820 |
10.06% |
| Oth |
 |
2,054 |
5.41% |
| Maj |
 |
13,785 |
36.31% |
| Turn |
 |
37,961 |
57.80% |
|
|
 |
Siobhain McDonagh
Labour hold
|
| LD |
Nicholas Harris |
3,820 |
10.06% |
| L |
Siobhain McDonagh |
22,936 |
60.42% |
| UK |
Adrian Roberts |
486 |
1.28% |
| C |
Harry Stokes |
9,151 |
24.11% |
| BNP |
John Tyndall |
642 |
1.69% |
| G |
Tom Walsh |
926 |
2.44% |
|
Candidates representing 6 parties stood for election to this seat.
|
|
 |
Siobhain McDonagh
Labour gain
|
| Con |
 |
14,243 |
29.71% |
| Lab |
 |
27,984 |
58.37% |
| LD |
 |
3,632 |
7.58% |
| Ref |
 |
810 |
1.69% |
| Oth |
 |
1,277 |
2.66% |
| Maj |
 |
13,741 |
28.66% |
| Turn |
 |
47,946 |
73.33% |
|
|
 |
|
Conservative
|
| Con |
 |
23,789 |
46.50% |
| Lab |
 |
22,055 |
43.10% |
| LD |
 |
4,687 |
9.20% |
| Oth |
 |
655 |
1.30% |
| Maj |
 |
1,734 |
3.40% |
| Turn |
 |
51,186 |
83.09% |
|
|
 |
|

|

