|
Mole Valley
Conservative hold

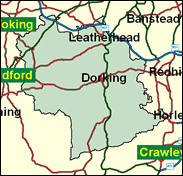
One of those seat whose name does not instantly divulge its whereabouts except to locals and cognoscenti, Mole Valley might better be described as the Surrey Hills (notably Leith and Box of that ilk), with its main towns Dorking and Leatherhead, and large numbers of not very agricultural villages catering for those liking the appearance and to some extent ambience of living in the countryside. They must be well off to do so here, for in late 2000 it was revealed that house prices in the county of Surrey are not only the highest in the country, but rocketing faster than anywhere else. The political consequences are entirely predictable.

Sir Paul Beresford, a New Zealand dentist, acquired his parliamentary seat and knighthood as a reward for converting Wandsworth Council into a Thatcherite Kingdom of Heaven on Earth in the 1980s, by pioneering the privatisation of local government services, his lasting memorial being a council still in Conservative control and providing from its ranks many of the current aspiring candidates in winnable seats. Born 1946 and educated at schools in Nelson, New Zealand and at Otago and London Universities, he practised dentistry on Park Lane until 1994, having been selected as MP in 1992. Converting badly from Wandsworth Town Hall to the Commons, he was semi-articulate as a Junior Environment Minister and disappeared onto the backbenches under Hague’s leadership.
 |
| Wealthy Achievers, Suburban Areas |
55.79% |
14.99% |
372.07 |
|
| Affluent Greys, Rural Communities |
0.53% |
2.13% |
25.10 |
|
| Prosperous Pensioners, Retirement Areas |
4.88% |
2.49% |
196.38 |
|
| Affluent Executives, Family Areas |
3.07% |
4.43% |
69.38 |
|
| Well-Off Workers, Family Areas |
3.36% |
7.27% |
46.17 |
|
| Affluent Urbanites, Town & City Areas |
2.85% |
2.56% |
111.01 |
|
| Prosperous Professionals, Metropolitan Areas |
1.73% |
2.04% |
84.90 |
|
| Better-Off Executives, Inner City Areas |
0.45% |
3.94% |
11.52 |
|
| Comfortable Middle Agers, Mature Home Owning Areas |
18.46% |
13.04% |
141.55 |
|
| Skilled Workers, Home Owning Areas |
0.88% |
12.70% |
6.90 |
|
| New Home Owners, Mature Communities |
4.12% |
8.14% |
50.62 |
|
| White Collar Workers, Better-Off Multi Ethnic Areas |
0.72% |
4.02% |
17.92 |
|
| Older People, Less Prosperous Areas |
0.55% |
3.19% |
17.15 |
|
| Council Estate Residents, Better-Off Homes |
1.97% |
11.31% |
17.40 |
|
| Council Estate Residents, High Unemployment |
0.64% |
3.06% |
20.84 |
|
| Council Estate Residents, Greatest Hardship |
0.01% |
2.52% |
0.27 |
|
| People in Multi-Ethnic, Low-Income Areas |
0.00% |
2.10% |
0.00 |
|
| Unclassified |
0.00% |
0.06% |
0.00 |
|
|
 |
 |
 |
| £0-5K |
4.51% |
9.41% |
47.96 |
|
| £5-10K |
9.01% |
16.63% |
54.19 |
|
| £10-15K |
11.03% |
16.58% |
66.50 |
|
| £15-20K |
11.02% |
13.58% |
81.15 |
|
| £20-25K |
10.06% |
10.39% |
96.80 |
|
| £25-30K |
8.77% |
7.77% |
112.76 |
|
| £30-35K |
7.45% |
5.79% |
128.63 |
|
| £35-40K |
6.25% |
4.33% |
144.15 |
|
| £40-45K |
5.20% |
3.27% |
159.17 |
|
| £45-50K |
4.31% |
2.48% |
173.60 |
|
| £50-55K |
3.57% |
1.90% |
187.41 |
|
| £55-60K |
2.96% |
1.47% |
200.58 |
|
| £60-65K |
2.45% |
1.15% |
213.11 |
|
| £65-70K |
2.04% |
0.91% |
225.03 |
|
| £70-75K |
1.70% |
0.72% |
236.35 |
|
| £75-80K |
1.42% |
0.57% |
247.10 |
|
| £80-85K |
1.19% |
0.46% |
257.32 |
|
| £85-90K |
1.00% |
0.37% |
267.03 |
|
| £90-95K |
0.84% |
0.31% |
276.25 |
|
| £95-100K |
0.71% |
0.25% |
285.03 |
|
| £100K + |
4.46% |
1.34% |
332.05 |
|
|
|

|


|
1992-1997
|
1997-2001
|
|
|
|
| Con |
-13.39% |
| Lab |
5.38% |
| LD |
0.67% |
|
| Con |
2.53% |
| Lab |
1.87% |
| LD |
-0.30% |
|
|
 |
Peter Beresford
Conservative hold
|
| Con |
 |
23,790 |
50.54% |
| Lab |
 |
7,837 |
16.65% |
| LD |
 |
13,637 |
28.97% |
| Oth |
 |
1,808 |
3.84% |
| Maj |
 |
10,153 |
21.57% |
| Turn |
 |
47,072 |
69.46% |
|
|
 |
Peter Beresford
Conservative hold
|
| C |
Peter Beresford |
23,790 |
50.54% |
| P |
William Newton |
475 |
1.01% |
| L |
Dan Redford |
7,837 |
16.65% |
| LD |
Celia Savage |
13,637 |
28.97% |
| UK |
Ron Walters |
1,333 |
2.83% |
|
Candidates representing 5 parties stood for election to this seat.
|
|
 |
Paul Beresford
Conservative
|
| Con |
 |
26,178 |
48.01% |
| Lab |
 |
8,057 |
14.78% |
| LD |
 |
15,957 |
29.27% |
| Ref |
 |
2,424 |
4.45% |
| Oth |
 |
1,908 |
3.50% |
| Maj |
 |
10,221 |
18.75% |
| Turn |
 |
54,524 |
78.86% |
|
|
 |
|
Conservative
|
| Con |
 |
35,313 |
61.40% |
| Lab |
 |
5,386 |
9.40% |
| LD |
 |
16,486 |
28.60% |
| Oth |
 |
373 |
0.60% |
| Maj |
 |
18,827 |
32.70% |
| Turn |
 |
57,558 |
81.64% |
|
|
 |
|

|

