|
Monmouth
Labour hold

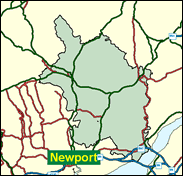
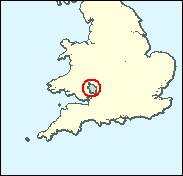
The Conservatives' single best chance of putting at least one win on the board outside England at the next General Election is clearly Monmouth, which they won at constituency level in the Welsh Assembly elections in May 1999 and comfortably in the Euro-votes the following month. It would now be a major surprise if Roger Evans did not regain this seat for a second time (having already done so in 1992, after the 1991 by-election loss) from Huw Edwards at the next General Election. Some have consistently argued that Monmouthshire is not actually part of Wales at all. It is 98pc English speaking, and Plaid Cymru polled scarcely one in a hundred votes here in 1997 (though six times that in the 1999 assembly elections). It definitely is in Wales for administrative purposes, but its politics as well as its culture and scenery seem as un-Welsh as those of any constituency technically within the principality.

Huw Edwards, a polytechnic lecturer who welcomed the conversion of the polytechnics into universities (and vice-versa), was first elected here in 1991, lost the seat in 1992 and regained it in 1997. He was born in 1953 into the London Welsh community, educated at Eastfields High School, Mitcham, Manchester Polytechnic and York University. A fan of Frank Field, as a social policy specialist, he operates quietly between the hammer of the Tory countryside and farming lobby and the Labour votes dependent on the Llanwern steelworks whose closure he vigorously denounced in February this year. The conservative barrister, Roger Evans, who has alternated with Edwards here as MP, stands again, the 17th best placed of the Conservative ex-MPs to make a successful come-back. Born 1947 and educated at Bristol Grammar School and Trinity Hall Cambridge, as a junior minister under Major he piloted the Job Seekers Act, curbing access to the dole. An experienced loser of Tory seats (here in 1991 and 1997, and in Anglesey in 1987) he had curbed his Thatcherism sufficiently under Major during the Maastricht debates to win office in Major’s last three years.
 |
| Wealthy Achievers, Suburban Areas |
40.19% |
14.99% |
268.02 |
|
| Affluent Greys, Rural Communities |
4.79% |
2.13% |
225.21 |
|
| Prosperous Pensioners, Retirement Areas |
2.29% |
2.49% |
92.23 |
|
| Affluent Executives, Family Areas |
3.22% |
4.43% |
72.82 |
|
| Well-Off Workers, Family Areas |
1.30% |
7.27% |
17.81 |
|
| Affluent Urbanites, Town & City Areas |
0.26% |
2.56% |
10.28 |
|
| Prosperous Professionals, Metropolitan Areas |
0.00% |
2.04% |
0.00 |
|
| Better-Off Executives, Inner City Areas |
0.40% |
3.94% |
10.23 |
|
| Comfortable Middle Agers, Mature Home Owning Areas |
17.01% |
13.04% |
130.45 |
|
| Skilled Workers, Home Owning Areas |
10.91% |
12.70% |
85.90 |
|
| New Home Owners, Mature Communities |
9.71% |
8.14% |
119.22 |
|
| White Collar Workers, Better-Off Multi Ethnic Areas |
2.09% |
4.02% |
51.86 |
|
| Older People, Less Prosperous Areas |
3.27% |
3.19% |
102.53 |
|
| Council Estate Residents, Better-Off Homes |
2.87% |
11.31% |
25.39 |
|
| Council Estate Residents, High Unemployment |
0.19% |
3.06% |
6.16 |
|
| Council Estate Residents, Greatest Hardship |
1.50% |
2.52% |
59.66 |
|
| People in Multi-Ethnic, Low-Income Areas |
0.00% |
2.10% |
0.00 |
|
| Unclassified |
0.00% |
0.06% |
6.01 |
|
|
 |
 |
 |
| £0-5K |
9.14% |
9.41% |
97.13 |
|
| £5-10K |
16.00% |
16.63% |
96.18 |
|
| £10-15K |
16.11% |
16.58% |
97.16 |
|
| £15-20K |
13.35% |
13.58% |
98.28 |
|
| £20-25K |
10.33% |
10.39% |
99.35 |
|
| £25-30K |
7.80% |
7.77% |
100.38 |
|
| £30-35K |
5.87% |
5.79% |
101.40 |
|
| £35-40K |
4.44% |
4.33% |
102.40 |
|
| £40-45K |
3.38% |
3.27% |
103.39 |
|
| £45-50K |
2.59% |
2.48% |
104.37 |
|
| £50-55K |
2.01% |
1.90% |
105.34 |
|
| £55-60K |
1.57% |
1.47% |
106.30 |
|
| £60-65K |
1.23% |
1.15% |
107.25 |
|
| £65-70K |
0.98% |
0.91% |
108.20 |
|
| £70-75K |
0.78% |
0.72% |
109.13 |
|
| £75-80K |
0.63% |
0.57% |
110.06 |
|
| £80-85K |
0.51% |
0.46% |
110.99 |
|
| £85-90K |
0.42% |
0.37% |
111.92 |
|
| £90-95K |
0.34% |
0.31% |
112.84 |
|
| £95-100K |
0.28% |
0.25% |
113.76 |
|
| £100K + |
1.62% |
1.34% |
120.35 |
|
|
|

|


|
1992-1997
|
1997-2001
|
|
|
|
| Con |
-8.08% |
| Lab |
6.74% |
| LD |
-1.34% |
| PC |
1.05% |
|
| Con |
2.70% |
| Lab |
-4.96% |
| LD |
1.86% |
| PC |
1.35% |
|
|
 |
Huw Edwards
Labour hold
|
| Con |
 |
18,637 |
41.92% |
| Lab |
 |
19,021 |
42.78% |
| LD |
 |
5,080 |
11.43% |
| PC |
 |
1,068 |
2.40% |
| Oth |
 |
656 |
1.48% |
| Maj |
 |
384 |
0.86% |
| Turn |
 |
44,462 |
71.48% |
|
|
 |
Huw Edwards
Labour hold
|
| L |
Huw Edwards |
19,021 |
42.78% |
| C |
Roger Evans |
18,637 |
41.92% |
| PC |
Marc Hubbard |
1,068 |
2.40% |
| LD |
Neil Parker |
5,080 |
11.43% |
| UK |
David Rowlands |
656 |
1.48% |
|
Candidates representing 5 parties stood for election to this seat.
|
|
 |
Huw Edwards
Labour gain
|
| Con |
 |
19,226 |
39.22% |
| Lab |
 |
23,404 |
47.74% |
| LD |
 |
4,689 |
9.56% |
| PC |
 |
516 |
1.05% |
| Ref |
 |
1,190 |
2.43% |
| Oth |
|
0 |
0.00% |
| Maj |
 |
4,178 |
8.52% |
| Turn |
 |
49,025 |
80.76% |
|
|
 |
|
Conservative
|
| Con |
 |
24,059 |
47.30% |
| Lab |
 |
20,855 |
41.00% |
| LD |
 |
5,562 |
10.90% |
| Oth |
 |
431 |
0.80% |
| Maj |
 |
3,204 |
6.30% |
| Turn |
 |
50,907 |
84.98% |
|
|
 |
|

|

