|
Bedfordshire South West
Conservative hold

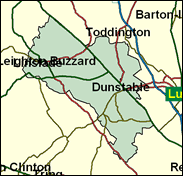
One of the few seats held by the Conservatives in 1997 when its predecessor, (with somewhat different boundaries) fell to Labour in their other landslide year of 1966. This seat has a new Tory candidate (and likely winner) in Andrew Selous, following the departure of Sir David Madel. Why should SW Bedfordshire have remained Tory in 1997? This may have something to do with the extraordinary level of dislike felt in this seat for its large neighbour, Luton. In a poll for the Local Government Commission in the mid 1990s no less than 40pc of respondents in South Bedfordshire volunteered Luton as a place they particularly loathed, the highest figure recorded anywhere in the country. The residents of Dunstable and Houghton Regis, the two largest units in this seat, may be within Luton's economic ambit, but they do not like being associated with it. This seat is 98pc white, while Luton has a large and prominent ethnic minority. The workers here formed the heart of the "Affluent Worker" study of the 1970s, which revealed instrumental (that is self- not class- determined) voting on a huge scale. As a result, south west Bedfordshire swung massively to the Tories in the 1980s, and although its movement back in the Nineties was average for the region, Labour could not recover the seat they had won in 1966.

Insurance underwriter with Great Lakes Reinsurance PLC, and director of a family electronics business from 1984 to 1994, Andrew Selous, who fought Sunderland North in 1997, has replaced retiring Sir David Madel, as Conservative candidate here. An LSE graduate, born in 1962, he is an activist in the Battersea part of the Tory flagship borough of Wandsworth, and a keen advocate of Nato as the UK's key defence pact and of the UK being competitive internationally as well as in Europe. As in three other of Labour's top ten target seats for gains from the Conservatives (Dorset South, Bury St Edmunds and Bosworth), Labour have selected their narrowly-defeated challenger again. Andrew Date, in this case, is a teacher and South Bedfordshire councillor, representing Beaudesert ward in Dunstable, who became leader of the Labour group and council leader. His 45th birthday has fallen during the campaign on May 17.
 |
| Wealthy Achievers, Suburban Areas |
13.19% |
14.99% |
88.00 |
|
| Affluent Greys, Rural Communities |
0.01% |
2.13% |
0.25 |
|
| Prosperous Pensioners, Retirement Areas |
0.51% |
2.49% |
20.35 |
|
| Affluent Executives, Family Areas |
12.99% |
4.43% |
293.63 |
|
| Well-Off Workers, Family Areas |
23.86% |
7.27% |
328.07 |
|
| Affluent Urbanites, Town & City Areas |
1.35% |
2.56% |
52.59 |
|
| Prosperous Professionals, Metropolitan Areas |
0.00% |
2.04% |
0.00 |
|
| Better-Off Executives, Inner City Areas |
0.23% |
3.94% |
5.91 |
|
| Comfortable Middle Agers, Mature Home Owning Areas |
9.19% |
13.04% |
70.48 |
|
| Skilled Workers, Home Owning Areas |
14.16% |
12.70% |
111.44 |
|
| New Home Owners, Mature Communities |
5.46% |
8.14% |
67.00 |
|
| White Collar Workers, Better-Off Multi Ethnic Areas |
1.38% |
4.02% |
34.29 |
|
| Older People, Less Prosperous Areas |
3.31% |
3.19% |
103.92 |
|
| Council Estate Residents, Better-Off Homes |
12.64% |
11.31% |
111.77 |
|
| Council Estate Residents, High Unemployment |
0.19% |
3.06% |
6.27 |
|
| Council Estate Residents, Greatest Hardship |
1.53% |
2.52% |
60.63 |
|
| People in Multi-Ethnic, Low-Income Areas |
0.00% |
2.10% |
0.00 |
|
| Unclassified |
0.01% |
0.06% |
8.42 |
|
|
 |
 |
 |
| £0-5K |
6.84% |
9.41% |
72.62 |
|
| £5-10K |
13.46% |
16.63% |
80.95 |
|
| £10-15K |
15.08% |
16.58% |
90.97 |
|
| £15-20K |
13.58% |
13.58% |
99.98 |
|
| £20-25K |
11.16% |
10.39% |
107.34 |
|
| £25-30K |
8.79% |
7.77% |
113.10 |
|
| £30-35K |
6.80% |
5.79% |
117.48 |
|
| £35-40K |
5.23% |
4.33% |
120.76 |
|
| £40-45K |
4.02% |
3.27% |
123.16 |
|
| £45-50K |
3.10% |
2.48% |
124.87 |
|
| £50-55K |
2.40% |
1.90% |
126.03 |
|
| £55-60K |
1.87% |
1.47% |
126.76 |
|
| £60-65K |
1.46% |
1.15% |
127.15 |
|
| £65-70K |
1.15% |
0.91% |
127.26 |
|
| £70-75K |
0.91% |
0.72% |
127.16 |
|
| £75-80K |
0.73% |
0.57% |
126.89 |
|
| £80-85K |
0.58% |
0.46% |
126.48 |
|
| £85-90K |
0.47% |
0.37% |
125.96 |
|
| £90-95K |
0.38% |
0.31% |
125.35 |
|
| £95-100K |
0.31% |
0.25% |
124.67 |
|
| £100K + |
1.59% |
1.34% |
118.50 |
|
|
|

|


|
1992-1997
|
1997-2001
|
|
|
|
| Con |
-15.47% |
| Lab |
14.79% |
| LD |
-2.30% |
|
| Con |
1.40% |
| Lab |
-0.12% |
| LD |
0.46% |
|
|
 |
Andrew Selous
Conservative hold
|
| Con |
 |
18,477 |
42.13% |
| Lab |
 |
17,701 |
40.36% |
| LD |
 |
6,473 |
14.76% |
| Oth |
 |
1,203 |
2.74% |
| Maj |
 |
776 |
1.77% |
| Turn |
 |
43,854 |
60.80% |
|
|
 |
Andrew Selous
Conservative hold
|
| L |
Andrew Date |
17,701 |
40.36% |
| LD |
Martin Pantling |
6,473 |
14.76% |
| C |
Andrew Selous |
18,477 |
42.13% |
| UK |
Tom Wise |
1,203 |
2.74% |
|
Candidates representing 4 parties stood for election to this seat.
|
|
 |
David Madel
Conservative
|
| Con |
 |
21,534 |
40.73% |
| Lab |
 |
21,402 |
40.49% |
| LD |
 |
7,559 |
14.30% |
| Ref |
 |
1,761 |
3.33% |
| Oth |
 |
608 |
1.15% |
| Maj |
 |
132 |
0.25% |
| Turn |
 |
52,864 |
75.76% |
|
|
 |
|
Conservative
|
| Con |
 |
32,000 |
56.20% |
| Lab |
 |
14,660 |
25.70% |
| LD |
 |
9,475 |
16.60% |
| Oth |
 |
818 |
1.40% |
| Maj |
 |
17,340 |
30.40% |
| Turn |
 |
56,953 |
81.68% |
|
|
 |
|

|

