|
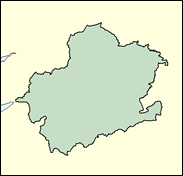
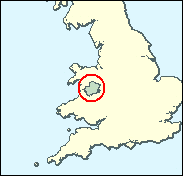
Montgomeryshire
Liberal Democrat hold

Do not be fooled by a name (and accent) originating far from Mid Wales, or by the Conservatives strong showing here in the 1999 Euro-elections; this seat is well nigh safe for the Liberal Democrats' Lembit Opik. Indeed with one aberrant period at the height of Thatcherism (1979-83) this seat has been Liberal for over a century. It recorded the second highest percentage of workers employed in agriculture and related occupations in the 1991 Census, after Galloway and Upper Nithsdale, which tends to coincide with either Liberal or Nationalist preferences in both Wales and Scotland - it is closely followed in this particular list by Ceredigion, Carmarthen East/Dinefwr (which Plaid Cymru are likely to win from Labour next time), Orkney/Shetland and Brecon/Radnor. Farmers are independent folk who do not seem to like governments of any colour very much.

Lembit Opik, Ulster-born of Estonian parents, won this most traditional of Liberal seats in 1997, and broke his back hang-gliding in 1998. A tall, thin man with an engaging lopsided smile, and a pin-ball whizkid, he was born in 1965, educated at Royal Belfast Academical Institution and Bristol University, and worked for Proctor & Gamble in Newcastle for nine years before taking to the Montgomeryshire hills. He is essentially a two-club politician: predicting the wipe-out of the planet by oncoming rogue asteroids, and urging a ‘Third Way’ between banning fox hunting and permitting its unlicensed continuance, preferably before the asteroids arrive. This latter compromise proposal was backed by some of his Liberal Democrat colleagues, but few others in a vote early this year. The Commons only Lutheran, he has pointed out that his Scrabble-evoking name rearranged spells “I kil to be MP.”
 |
| Wealthy Achievers, Suburban Areas |
4.80% |
14.99% |
32.02 |
|
| Affluent Greys, Rural Communities |
41.36% |
2.13% |
1,945.09 |
|
| Prosperous Pensioners, Retirement Areas |
0.57% |
2.49% |
22.77 |
|
| Affluent Executives, Family Areas |
0.37% |
4.43% |
8.45 |
|
| Well-Off Workers, Family Areas |
1.60% |
7.27% |
21.96 |
|
| Affluent Urbanites, Town & City Areas |
0.00% |
2.56% |
0.00 |
|
| Prosperous Professionals, Metropolitan Areas |
0.00% |
2.04% |
0.00 |
|
| Better-Off Executives, Inner City Areas |
0.49% |
3.94% |
12.46 |
|
| Comfortable Middle Agers, Mature Home Owning Areas |
18.31% |
13.04% |
140.44 |
|
| Skilled Workers, Home Owning Areas |
4.94% |
12.70% |
38.93 |
|
| New Home Owners, Mature Communities |
6.04% |
8.14% |
74.13 |
|
| White Collar Workers, Better-Off Multi Ethnic Areas |
4.27% |
4.02% |
106.22 |
|
| Older People, Less Prosperous Areas |
5.16% |
3.19% |
161.99 |
|
| Council Estate Residents, Better-Off Homes |
9.36% |
11.31% |
82.71 |
|
| Council Estate Residents, High Unemployment |
0.00% |
3.06% |
0.00 |
|
| Council Estate Residents, Greatest Hardship |
2.73% |
2.52% |
108.52 |
|
| People in Multi-Ethnic, Low-Income Areas |
0.00% |
2.10% |
0.00 |
|
| Unclassified |
0.00% |
0.06% |
0.00 |
|
|
 |
 |
 |
| £0-5K |
9.42% |
9.41% |
100.10 |
|
| £5-10K |
20.08% |
16.63% |
120.75 |
|
| £10-15K |
20.14% |
16.58% |
121.46 |
|
| £15-20K |
15.46% |
13.58% |
113.84 |
|
| £20-25K |
10.81% |
10.39% |
104.03 |
|
| £25-30K |
7.34% |
7.77% |
94.42 |
|
| £30-35K |
4.97% |
5.79% |
85.73 |
|
| £35-40K |
3.38% |
4.33% |
78.07 |
|
| £40-45K |
2.33% |
3.27% |
71.36 |
|
| £45-50K |
1.63% |
2.48% |
65.47 |
|
| £50-55K |
1.15% |
1.90% |
60.29 |
|
| £55-60K |
0.82% |
1.47% |
55.71 |
|
| £60-65K |
0.59% |
1.15% |
51.64 |
|
| £65-70K |
0.44% |
0.91% |
48.00 |
|
| £70-75K |
0.32% |
0.72% |
44.74 |
|
| £75-80K |
0.24% |
0.57% |
41.80 |
|
| £80-85K |
0.18% |
0.46% |
39.14 |
|
| £85-90K |
0.14% |
0.37% |
36.73 |
|
| £90-95K |
0.11% |
0.31% |
34.54 |
|
| £95-100K |
0.08% |
0.25% |
32.54 |
|
| £100K + |
0.32% |
1.34% |
23.58 |
|
|
|

|


|
1992-1997
|
1997-2001
|
|
|
|
| Con |
-6.56% |
| Lab |
6.74% |
| LD |
-2.62% |
| PC |
0.24% |
|
| Con |
1.76% |
| Lab |
-7.26% |
| LD |
3.53% |
| PC |
1.76% |
|
|
 |
Lembit Opik
Liberal Democrat hold
|
| Con |
 |
8,085 |
27.90% |
| Lab |
 |
3,443 |
11.88% |
| LD |
 |
14,319 |
49.40% |
| PC |
 |
1,969 |
6.79% |
| Oth |
 |
1,167 |
4.03% |
| Maj |
 |
6,234 |
21.51% |
| Turn |
 |
28,983 |
65.51% |
|
|
 |
Lembit Opik
Liberal Democrat hold
|
| L |
Paul Davies |
3,443 |
11.88% |
| P |
Ruth Davies |
210 |
0.72% |
| C |
David Jones |
8,085 |
27.90% |
| LD |
Lembit Opik |
14,319 |
49.40% |
| UK |
David Rowlands |
786 |
2.71% |
| PC |
David Senior |
1,969 |
6.79% |
| I |
Reg Taylor |
171 |
0.59% |
|
Candidates representing 7 parties stood for election to this seat.
|
|
 |
Lembit Opik
Liberal Democrat
|
| Con |
 |
8,344 |
26.14% |
| Lab |
 |
6,109 |
19.14% |
| LD |
 |
14,647 |
45.88% |
| PC |
 |
1,608 |
5.04% |
| Ref |
 |
879 |
2.75% |
| Oth |
 |
338 |
1.06% |
| Maj |
 |
6,303 |
19.74% |
| Turn |
 |
31,925 |
74.91% |
|
|
 |
|
Liberal Democrat
|
| Con |
 |
10,822 |
32.70% |
| Lab |
 |
4,115 |
12.40% |
| LD |
 |
16,031 |
48.50% |
| PC |
 |
1,581 |
4.80% |
| Oth |
 |
508 |
1.50% |
| Maj |
 |
5,209 |
15.80% |
| Turn |
 |
33,057 |
78.45% |
|
|
 |
|

|

