|
Moray
Scottish National Party hold

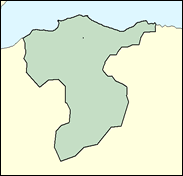
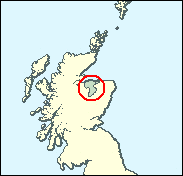
All the present Scottish National Party MPs have won seats in the Holyrood Parliament and will be migrating there full time, leaving Westminster at the next general election; all, even members of the Ewing dynasty, are likely to be able to hand these seats on though, to fresh faces from their party, especially in their more established seats like Moray, on the north east coast not far from Inverness.

Angus Robertson, is the SNP’s new candidate here as Margaret Ewing leaves to concentrate on the Scottish Parliament. He was born (in London) in 1969, educated at Broughton High School, Edinburgh and at Aberdeen University, where he studied politics and international relations. A former journalist, he currently works as European policy adviser to the SNP group in the Scottish Parliament, to which he failed to get elected as candidate for Midlothian in 1999. He has attacked Liberal Democrat Scottish agriculture minister Ross Finnie for neglecting his duties in Europe.
 |
| Wealthy Achievers, Suburban Areas |
6.84% |
14.99% |
45.65 |
|
| Affluent Greys, Rural Communities |
8.48% |
2.13% |
398.93 |
|
| Prosperous Pensioners, Retirement Areas |
1.47% |
2.49% |
59.26 |
|
| Affluent Executives, Family Areas |
6.86% |
4.43% |
155.06 |
|
| Well-Off Workers, Family Areas |
4.75% |
7.27% |
65.28 |
|
| Affluent Urbanites, Town & City Areas |
1.22% |
2.56% |
47.55 |
|
| Prosperous Professionals, Metropolitan Areas |
0.00% |
2.04% |
0.00 |
|
| Better-Off Executives, Inner City Areas |
1.43% |
3.94% |
36.19 |
|
| Comfortable Middle Agers, Mature Home Owning Areas |
12.59% |
13.04% |
96.55 |
|
| Skilled Workers, Home Owning Areas |
10.08% |
12.70% |
79.32 |
|
| New Home Owners, Mature Communities |
12.16% |
8.14% |
149.34 |
|
| White Collar Workers, Better-Off Multi Ethnic Areas |
2.04% |
4.02% |
50.79 |
|
| Older People, Less Prosperous Areas |
3.86% |
3.19% |
121.17 |
|
| Council Estate Residents, Better-Off Homes |
21.66% |
11.31% |
191.46 |
|
| Council Estate Residents, High Unemployment |
1.42% |
3.06% |
46.31 |
|
| Council Estate Residents, Greatest Hardship |
5.14% |
2.52% |
204.11 |
|
| People in Multi-Ethnic, Low-Income Areas |
0.00% |
2.10% |
0.00 |
|
| Unclassified |
0.00% |
0.06% |
0.00 |
|
|
 |
 |
 |
| £0-5K |
8.34% |
9.41% |
88.57 |
|
| £5-10K |
16.89% |
16.63% |
101.55 |
|
| £10-15K |
17.98% |
16.58% |
108.43 |
|
| £15-20K |
15.05% |
13.58% |
110.81 |
|
| £20-25K |
11.43% |
10.39% |
109.98 |
|
| £25-30K |
8.33% |
7.77% |
107.10 |
|
| £30-35K |
5.97% |
5.79% |
103.02 |
|
| £35-40K |
4.26% |
4.33% |
98.32 |
|
| £40-45K |
3.05% |
3.27% |
93.40 |
|
| £45-50K |
2.20% |
2.48% |
88.49 |
|
| £50-55K |
1.60% |
1.90% |
83.75 |
|
| £55-60K |
1.17% |
1.47% |
79.26 |
|
| £60-65K |
0.86% |
1.15% |
75.04 |
|
| £65-70K |
0.64% |
0.91% |
71.12 |
|
| £70-75K |
0.49% |
0.72% |
67.49 |
|
| £75-80K |
0.37% |
0.57% |
64.14 |
|
| £80-85K |
0.28% |
0.46% |
61.04 |
|
| £85-90K |
0.22% |
0.37% |
58.19 |
|
| £90-95K |
0.17% |
0.31% |
55.57 |
|
| £95-100K |
0.13% |
0.25% |
53.14 |
|
| £100K + |
0.56% |
1.34% |
41.92 |
|
|
|

|


|
1992-1997
|
1997-2001
|
|
|
|
| Con |
-9.93% |
| Lab |
7.93% |
| LD |
2.92% |
| SNP |
-3.03% |
|
| Con |
-4.46% |
| Lab |
5.25% |
| LD |
6.80% |
| SNP |
-11.24% |
|
|
 |
Angus Robertson
Scottish National Party hold
|
| Con |
 |
7,677 |
23.11% |
| Lab |
 |
8,332 |
25.08% |
| LD |
 |
5,224 |
15.72% |
| SNP |
 |
10,076 |
30.33% |
| Oth |
 |
1,914 |
5.76% |
| Maj |
 |
1,744 |
5.25% |
| Turn |
 |
33,223 |
57.27% |
|
|
 |
Angus Robertson
Scottish National Party hold
|
| SSP |
Norma Anderson |
821 |
2.47% |
| LD |
Linda Gorn |
5,224 |
15.72% |
| I |
Bill Jappy |
802 |
2.41% |
| UK |
Nigel Kenyon |
291 |
0.88% |
| L |
Catriona Munro |
8,332 |
25.08% |
| SNP |
Angus Robertson |
10,076 |
30.33% |
| C |
Frank Spencer-Nairn |
7,677 |
23.11% |
|
Candidates representing 7 parties stood for election to this seat.
|
|
 |
Margaret Ewing
Scottish National Party
|
| Con |
 |
10,963 |
27.57% |
| Lab |
 |
7,886 |
19.83% |
| LD |
 |
3,548 |
8.92% |
| SNP |
 |
16,529 |
41.57% |
| Ref |
 |
840 |
2.11% |
| Oth |
|
0 |
0.00% |
| Maj |
 |
5,566 |
14.00% |
| Turn |
 |
39,766 |
68.21% |
|
|
 |
|
Scottish National Party
|
| Con |
 |
15,517 |
37.50% |
| Lab |
 |
4,913 |
11.90% |
| LD |
 |
2,466 |
6.00% |
| SNP |
 |
18,444 |
44.60% |
| Oth |
|
0 |
0.00% |
| Maj |
 |
2,927 |
7.10% |
| Turn |
 |
41,340 |
71.59% |
|
|
 |
|

|

