|
Morecambe & Lunesdale
Labour hold

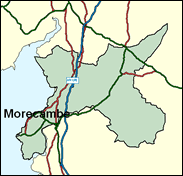
As in neighbouring Lancaster and Wyre, Labour has a major task in holding this mixture of town and country in North Lancashire, as the local elections and the Euro elections, both in 1999, suggest. They can really rely on little other than the Lancaster council estate of Skerton on the west bank of the Lune. Geraldine Smith's task is made somewhat easier by the clearer margin of her victory than that of Hilton Dawson next door in 1997, but it will remain a steeply uphill task to hold off the Tories' David Nuttall.

Geraldine Smith is one of Labour’s less conspicuous as well as least expected MPs. Formerly a GPO clerk, she was born in 1961 and locally educated at Morecambe High School and Morecambe & Lancaster College. Locally-focused in her campaigning against seaside town decline, she has salted her record only with politically-incorrect votes against homosexual law reform.
 |
| Wealthy Achievers, Suburban Areas |
11.30% |
14.99% |
75.37 |
|
| Affluent Greys, Rural Communities |
3.05% |
2.13% |
143.29 |
|
| Prosperous Pensioners, Retirement Areas |
4.82% |
2.49% |
193.69 |
|
| Affluent Executives, Family Areas |
2.05% |
4.43% |
46.41 |
|
| Well-Off Workers, Family Areas |
2.32% |
7.27% |
31.84 |
|
| Affluent Urbanites, Town & City Areas |
0.50% |
2.56% |
19.46 |
|
| Prosperous Professionals, Metropolitan Areas |
0.00% |
2.04% |
0.00 |
|
| Better-Off Executives, Inner City Areas |
7.00% |
3.94% |
177.51 |
|
| Comfortable Middle Agers, Mature Home Owning Areas |
27.05% |
13.04% |
207.44 |
|
| Skilled Workers, Home Owning Areas |
17.13% |
12.70% |
134.83 |
|
| New Home Owners, Mature Communities |
12.00% |
8.14% |
147.31 |
|
| White Collar Workers, Better-Off Multi Ethnic Areas |
3.49% |
4.02% |
86.89 |
|
| Older People, Less Prosperous Areas |
1.85% |
3.19% |
58.02 |
|
| Council Estate Residents, Better-Off Homes |
5.42% |
11.31% |
47.96 |
|
| Council Estate Residents, High Unemployment |
1.10% |
3.06% |
35.87 |
|
| Council Estate Residents, Greatest Hardship |
0.93% |
2.52% |
36.99 |
|
| People in Multi-Ethnic, Low-Income Areas |
0.00% |
2.10% |
0.00 |
|
| Unclassified |
0.00% |
0.06% |
0.00 |
|
|
 |
 |
 |
| £0-5K |
10.59% |
9.41% |
112.54 |
|
| £5-10K |
19.23% |
16.63% |
115.59 |
|
| £10-15K |
18.71% |
16.58% |
112.85 |
|
| £15-20K |
14.58% |
13.58% |
107.34 |
|
| £20-25K |
10.49% |
10.39% |
100.94 |
|
| £25-30K |
7.35% |
7.77% |
94.59 |
|
| £30-35K |
5.14% |
5.79% |
88.68 |
|
| £35-40K |
3.61% |
4.33% |
83.35 |
|
| £40-45K |
2.57% |
3.27% |
78.61 |
|
| £45-50K |
1.85% |
2.48% |
74.40 |
|
| £50-55K |
1.35% |
1.90% |
70.68 |
|
| £55-60K |
0.99% |
1.47% |
67.39 |
|
| £60-65K |
0.74% |
1.15% |
64.46 |
|
| £65-70K |
0.56% |
0.91% |
61.84 |
|
| £70-75K |
0.43% |
0.72% |
59.51 |
|
| £75-80K |
0.33% |
0.57% |
57.41 |
|
| £80-85K |
0.26% |
0.46% |
55.51 |
|
| £85-90K |
0.20% |
0.37% |
53.80 |
|
| £90-95K |
0.16% |
0.31% |
52.24 |
|
| £95-100K |
0.13% |
0.25% |
50.81 |
|
| £100K + |
0.60% |
1.34% |
44.37 |
|
|
|

|


|
1992-1997
|
1997-2001
|
|
|
|
| Con |
-12.46% |
| Lab |
19.46% |
| LD |
-7.70% |
|
| Con |
0.60% |
| Lab |
0.71% |
| LD |
-2.24% |
|
|
 |
Geraldine Smith
Labour hold
|
| Con |
 |
15,554 |
37.34% |
| Lab |
 |
20,646 |
49.56% |
| LD |
 |
3,817 |
9.16% |
| Oth |
 |
1,638 |
3.93% |
| Maj |
 |
5,092 |
12.22% |
| Turn |
 |
41,655 |
60.72% |
|
|
 |
Geraldine Smith
Labour hold
|
| G |
Charith Adams |
703 |
1.69% |
| UK |
Gregg Beaman |
935 |
2.24% |
| LD |
Chris Cotton |
3,817 |
9.16% |
| C |
David Nuttall |
15,554 |
37.34% |
| L |
Geraldine Smith |
20,646 |
49.56% |
|
Candidates representing 5 parties stood for election to this seat.
|
|
 |
Geraldine Smith
Labour gain
|
| Con |
 |
18,096 |
36.74% |
| Lab |
 |
24,061 |
48.86% |
| LD |
 |
5,614 |
11.40% |
| Ref |
 |
1,313 |
2.67% |
| Oth |
 |
165 |
0.34% |
| Maj |
 |
5,965 |
12.11% |
| Turn |
 |
49,249 |
72.41% |
|
|
 |
|
Conservative
|
| Con |
 |
26,292 |
49.20% |
| Lab |
 |
15,720 |
29.40% |
| LD |
 |
10,183 |
19.10% |
| Oth |
 |
1,223 |
2.30% |
| Maj |
 |
10,572 |
19.80% |
| Turn |
 |
53,418 |
78.13% |
|
|
 |
|

|

