|
Morley & Rothwell
Labour hold

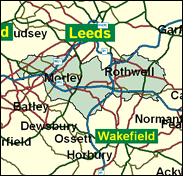
Despite its name, this is only a city of Leeds seat because of the expansion of boundaries which made the West Yorkshire metropolis the third most populous local authority in England (actually the second before Greater London went through its recent limited incarnation of the GLA). Only one ward within the historic, pre 1974, boundaries of Leeds is in this division, and that is the peripheral council estate of Middleton. Morley and Rothwell are essentially smaller and more independent towns, with a different political tradition. There are Conservative voters in Morley, especially Morley North, and Liberal Democrats in Rothwell. This is not inner city territory at all. A quarter of the voters are in professional and managerial occupations, and only a quarter in council housing, even with Middleton. Overall the seat is still Labour, but it only ranks about half way up their current list of nearly 420, and thus would be in the bottom half were they to lose, say 50 seats next time.

Colin Challen is Labour’s replacement for the prematurely aged and retiring MP John Gunnell. Born 1953 and educated at Norton Secondary School, Malton Grammar School and Hull University, he has worked as a self-employed printer and publisher and for six years as a Labour Party organiser, and was for eight years a Hull City councillor. Author of a book on Tory Party “secret funding,” he also as a keen member of the League Against Cruel Sports, backed the banning of Anne Mallalieu’s pro-hunting fringe meeting at the Brighton Labour Party Conference in 2000.
 |
| Wealthy Achievers, Suburban Areas |
3.77% |
14.99% |
25.13 |
|
| Affluent Greys, Rural Communities |
0.00% |
2.13% |
0.00 |
|
| Prosperous Pensioners, Retirement Areas |
0.03% |
2.49% |
1.30 |
|
| Affluent Executives, Family Areas |
4.54% |
4.43% |
102.68 |
|
| Well-Off Workers, Family Areas |
19.38% |
7.27% |
266.46 |
|
| Affluent Urbanites, Town & City Areas |
0.66% |
2.56% |
25.90 |
|
| Prosperous Professionals, Metropolitan Areas |
0.00% |
2.04% |
0.00 |
|
| Better-Off Executives, Inner City Areas |
0.00% |
3.94% |
0.00 |
|
| Comfortable Middle Agers, Mature Home Owning Areas |
13.94% |
13.04% |
106.89 |
|
| Skilled Workers, Home Owning Areas |
18.48% |
12.70% |
145.45 |
|
| New Home Owners, Mature Communities |
12.75% |
8.14% |
156.51 |
|
| White Collar Workers, Better-Off Multi Ethnic Areas |
0.19% |
4.02% |
4.82 |
|
| Older People, Less Prosperous Areas |
8.01% |
3.19% |
251.31 |
|
| Council Estate Residents, Better-Off Homes |
14.06% |
11.31% |
124.29 |
|
| Council Estate Residents, High Unemployment |
0.87% |
3.06% |
28.29 |
|
| Council Estate Residents, Greatest Hardship |
3.33% |
2.52% |
132.14 |
|
| People in Multi-Ethnic, Low-Income Areas |
0.00% |
2.10% |
0.00 |
|
| Unclassified |
0.00% |
0.06% |
0.00 |
|
|
 |
 |
 |
| £0-5K |
8.61% |
9.41% |
91.43 |
|
| £5-10K |
16.50% |
16.63% |
99.20 |
|
| £10-15K |
17.09% |
16.58% |
103.08 |
|
| £15-20K |
14.28% |
13.58% |
105.13 |
|
| £20-25K |
11.00% |
10.39% |
105.83 |
|
| £25-30K |
8.20% |
7.77% |
105.49 |
|
| £30-35K |
6.05% |
5.79% |
104.37 |
|
| £35-40K |
4.45% |
4.33% |
102.67 |
|
| £40-45K |
3.28% |
3.27% |
100.55 |
|
| £45-50K |
2.44% |
2.48% |
98.15 |
|
| £50-55K |
1.82% |
1.90% |
95.58 |
|
| £55-60K |
1.37% |
1.47% |
92.90 |
|
| £60-65K |
1.04% |
1.15% |
90.19 |
|
| £65-70K |
0.79% |
0.91% |
87.48 |
|
| £70-75K |
0.61% |
0.72% |
84.80 |
|
| £75-80K |
0.47% |
0.57% |
82.18 |
|
| £80-85K |
0.37% |
0.46% |
79.64 |
|
| £85-90K |
0.29% |
0.37% |
77.17 |
|
| £90-95K |
0.23% |
0.31% |
74.79 |
|
| £95-100K |
0.18% |
0.25% |
72.49 |
|
| £100K + |
0.80% |
1.34% |
59.82 |
|
|
|

|


|
1992-1997
|
1997-2001
|
|
|
|
| Con |
-10.57% |
| Lab |
8.97% |
| LD |
-1.92% |
|
| Con |
-0.76% |
| Lab |
-1.45% |
| LD |
3.08% |
|
|
 |
Colin Challen
Labour hold
|
| Con |
 |
9,829 |
25.57% |
| Lab |
 |
21,919 |
57.02% |
| LD |
 |
5,446 |
14.17% |
| Oth |
 |
1,248 |
3.25% |
| Maj |
 |
12,090 |
31.45% |
| Turn |
 |
38,442 |
53.53% |
|
|
 |
Colin Challen
Labour hold
|
| UK |
John Bardsley |
1,248 |
3.25% |
| L |
Colin Challen |
21,919 |
57.02% |
| LD |
Stewart Golton |
5,446 |
14.17% |
| C |
David Schofield |
9,829 |
25.57% |
|
Candidates representing 4 parties stood for election to this seat.
|
|
 |
John Gunnell
Labour
|
| Con |
 |
12,086 |
26.33% |
| Lab |
 |
26,836 |
58.47% |
| LD |
 |
5,087 |
11.08% |
| Ref |
 |
1,359 |
2.96% |
| Oth |
 |
529 |
1.15% |
| Maj |
 |
14,750 |
32.14% |
| Turn |
 |
45,897 |
67.12% |
|
|
 |
|
Labour
|
| Con |
 |
18,523 |
36.90% |
| Lab |
 |
24,843 |
49.50% |
| LD |
 |
6,506 |
13.00% |
| Oth |
 |
327 |
0.70% |
| Maj |
 |
6,320 |
12.60% |
| Turn |
 |
50,199 |
75.14% |
|
|
 |
|

|

