|
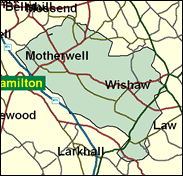
Motherwell & Wishaw
Labour hold

The fortunes of this seat may have risen and fallen with the fate of the vast Ravenscraig steel works, but its politics have remained fairly constantly faithfully Labour, and the SNP have recently failed to approach closer than the gap of 5,000 they achieved in the 1999 Scottish Parliament elections, even though this seat has almost the highest proportion of Scottish born residents (96pc), a figure exceeded only fractionally only in three other seats (Airdrie and Shotts; Glasgow Shettleston; Glasgow Baillieston) and even though it was once won narrowly in the distant past (1945) in a by-election and held for a very few months by Robert McIntyre.

Frank Roy, a local-born and locally Catholic-educated steel worker with a minimal mouth-encircling beard, who worked as a barman while studying at Glasgow Caledonian University after being made redundant, and then as bag-carrier for Labour MP Helen Liddell, was elected here in 1997. His profile was low until he was criticised for betting on the election of the Glaswegian Speaker Michael Martin, and then provoking the odder tribal spat over advising Irish PM Ahern not to visit Motherwell to open a shrine to the victims of the Irish potato famine, in case it caused sectarian strife. As PPS to Scottish Secretary Helen Liddell and ex-PPS to Northern Ireland Secretary John Reid, both of whom Catholics, it was unclear if this was a ruse to reassure working class Protestants who might fall for the SNP’s Orange blandishments. But by then resigning as a PPS, he might also have reassured Ulster Catholics; sophisticated Caledonian footwork, if true.
 |
| Wealthy Achievers, Suburban Areas |
2.69% |
14.99% |
17.94 |
|
| Affluent Greys, Rural Communities |
0.00% |
2.13% |
0.00 |
|
| Prosperous Pensioners, Retirement Areas |
0.09% |
2.49% |
3.47 |
|
| Affluent Executives, Family Areas |
2.75% |
4.43% |
62.13 |
|
| Well-Off Workers, Family Areas |
7.83% |
7.27% |
107.63 |
|
| Affluent Urbanites, Town & City Areas |
2.39% |
2.56% |
93.01 |
|
| Prosperous Professionals, Metropolitan Areas |
0.00% |
2.04% |
0.00 |
|
| Better-Off Executives, Inner City Areas |
0.14% |
3.94% |
3.61 |
|
| Comfortable Middle Agers, Mature Home Owning Areas |
5.32% |
13.04% |
40.82 |
|
| Skilled Workers, Home Owning Areas |
4.12% |
12.70% |
32.41 |
|
| New Home Owners, Mature Communities |
6.23% |
8.14% |
76.55 |
|
| White Collar Workers, Better-Off Multi Ethnic Areas |
0.31% |
4.02% |
7.73 |
|
| Older People, Less Prosperous Areas |
8.52% |
3.19% |
267.49 |
|
| Council Estate Residents, Better-Off Homes |
30.95% |
11.31% |
273.64 |
|
| Council Estate Residents, High Unemployment |
15.17% |
3.06% |
495.46 |
|
| Council Estate Residents, Greatest Hardship |
13.49% |
2.52% |
535.63 |
|
| People in Multi-Ethnic, Low-Income Areas |
0.00% |
2.10% |
0.00 |
|
| Unclassified |
0.00% |
0.06% |
0.00 |
|
|
 |
 |
 |
| £0-5K |
12.54% |
9.41% |
133.22 |
|
| £5-10K |
19.71% |
16.63% |
118.52 |
|
| £10-15K |
18.03% |
16.58% |
108.76 |
|
| £15-20K |
13.84% |
13.58% |
101.87 |
|
| £20-25K |
10.02% |
10.39% |
96.42 |
|
| £25-30K |
7.12% |
7.77% |
91.65 |
|
| £30-35K |
5.05% |
5.79% |
87.19 |
|
| £35-40K |
3.59% |
4.33% |
82.91 |
|
| £40-45K |
2.57% |
3.27% |
78.78 |
|
| £45-50K |
1.86% |
2.48% |
74.79 |
|
| £50-55K |
1.35% |
1.90% |
70.96 |
|
| £55-60K |
0.99% |
1.47% |
67.30 |
|
| £60-65K |
0.74% |
1.15% |
63.84 |
|
| £65-70K |
0.55% |
0.91% |
60.58 |
|
| £70-75K |
0.41% |
0.72% |
57.52 |
|
| £75-80K |
0.31% |
0.57% |
54.65 |
|
| £80-85K |
0.24% |
0.46% |
51.98 |
|
| £85-90K |
0.19% |
0.37% |
49.49 |
|
| £90-95K |
0.14% |
0.31% |
47.17 |
|
| £95-100K |
0.11% |
0.25% |
45.02 |
|
| £100K + |
0.47% |
1.34% |
34.87 |
|
|
|

|


|
1992-1997
|
1997-2001
|
|
|
|
| Con |
-4.61% |
| Lab |
0.90% |
| LD |
0.27% |
| SNP |
1.07% |
|
| Con |
-0.36% |
| Lab |
-1.19% |
| LD |
3.04% |
| SNP |
-3.18% |
|
|
 |
Frank Roy
Labour hold
|
| Con |
 |
3,155 |
10.63% |
| Lab |
 |
16,681 |
56.22% |
| LD |
 |
2,791 |
9.41% |
| SNP |
 |
5,725 |
19.29% |
| Oth |
 |
1,321 |
4.45% |
| Maj |
 |
10,956 |
36.92% |
| Turn |
 |
29,673 |
56.61% |
|
|
 |
Frank Roy
Labour hold
|
| LD |
Iain Brown |
2,791 |
9.41% |
| SNP |
Jim McGuigan |
5,725 |
19.29% |
| C |
Mark Nolan |
3,155 |
10.63% |
| L |
Frank Roy |
16,681 |
56.22% |
| SSP |
Stephen Smellie |
1,260 |
4.25% |
| SL |
Claire Watt |
61 |
0.21% |
|
Candidates representing 6 parties stood for election to this seat.
|
|
 |
Frank Roy
Labour
|
| Con |
 |
4,024 |
10.99% |
| Lab |
 |
21,020 |
57.40% |
| LD |
 |
2,331 |
6.37% |
| SNP |
 |
8,229 |
22.47% |
| Ref |
 |
218 |
0.60% |
| Oth |
 |
797 |
2.18% |
| Maj |
 |
12,791 |
34.93% |
| Turn |
 |
36,619 |
70.08% |
|
|
 |
|
Labour
|
| Con |
 |
6,264 |
15.60% |
| Lab |
 |
22,691 |
56.50% |
| LD |
 |
2,433 |
6.10% |
| SNP |
 |
8,601 |
21.40% |
| Oth |
 |
146 |
0.40% |
| Maj |
 |
14,090 |
35.10% |
| Turn |
 |
40,135 |
75.33% |
|
|
 |
|

|

