|
Neath
Labour hold

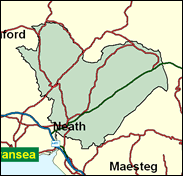
Neath is one of those many South Wales industrial valley constituencies which run in north-south strips along the dips in the folded and ridged landscape. It includes most of the Neath and Dulais valleys, and some of the Upper Swansea valley. At the southern end of the seat is the medium sized town of Neath itself. The lower reaches of the valleys are almost entirely given over to industry - at one time coal, later aluminium and engineering; many of the hillsides have been afforested for timber. This is all fairly typical for South Wales, and it shares many aspects of culture and social history too: the chapels, from which the sound of singing used to reverberate around the valleys, the rugby union grounds where it still does, and constantly the tradition of voting Labour, which gives even Peter Hain, who once famously disrupted a series of rugby games when trying to stop his native South African team from touring in the days of apartheid, a 27,000 majority here. Whisper it softly - politics may be even more important than rugby to some people even here.

Peter Hain, as Minister of State at the Foreign Office, wrote a highly prescient Fabian booklet in January 2001 entitled The End of Foreign Policy, for that is precisely what it was for him, as he was reshuffled immediately to the DTI as Energy Minister. He is a successful graft onto the Labour stem of a radical Liberal who made his name as an anti-Springbok campaigner and South African-framed alleged bank robber. Elected here in 1991 notwithstanding his earlier Rugby-cancelling activities, he is one of the Blair government’s residual Keynesians, of the sort who might at least theoretically justify a change of gear on public spending. Born 1950, educated in Pretoria until his radical anti-Apartheid parents moved to England, and then at Emanuel School, Wandsworth and Sussex University, he has handsome good looks and, like a good many politicians, is something of a solitary nature.
 |
| Wealthy Achievers, Suburban Areas |
8.55% |
14.99% |
57.01 |
|
| Affluent Greys, Rural Communities |
0.00% |
2.13% |
0.00 |
|
| Prosperous Pensioners, Retirement Areas |
0.02% |
2.49% |
0.66 |
|
| Affluent Executives, Family Areas |
2.67% |
4.43% |
60.34 |
|
| Well-Off Workers, Family Areas |
6.20% |
7.27% |
85.20 |
|
| Affluent Urbanites, Town & City Areas |
0.00% |
2.56% |
0.00 |
|
| Prosperous Professionals, Metropolitan Areas |
0.00% |
2.04% |
0.00 |
|
| Better-Off Executives, Inner City Areas |
0.23% |
3.94% |
5.94 |
|
| Comfortable Middle Agers, Mature Home Owning Areas |
12.40% |
13.04% |
95.10 |
|
| Skilled Workers, Home Owning Areas |
26.29% |
12.70% |
206.94 |
|
| New Home Owners, Mature Communities |
30.42% |
8.14% |
373.62 |
|
| White Collar Workers, Better-Off Multi Ethnic Areas |
0.58% |
4.02% |
14.51 |
|
| Older People, Less Prosperous Areas |
4.41% |
3.19% |
138.32 |
|
| Council Estate Residents, Better-Off Homes |
7.04% |
11.31% |
62.20 |
|
| Council Estate Residents, High Unemployment |
0.49% |
3.06% |
16.15 |
|
| Council Estate Residents, Greatest Hardship |
0.70% |
2.52% |
27.91 |
|
| People in Multi-Ethnic, Low-Income Areas |
0.00% |
2.10% |
0.00 |
|
| Unclassified |
0.00% |
0.06% |
0.00 |
|
|
 |
 |
 |
| £0-5K |
11.17% |
9.41% |
118.68 |
|
| £5-10K |
19.68% |
16.63% |
118.32 |
|
| £10-15K |
18.74% |
16.58% |
113.05 |
|
| £15-20K |
14.47% |
13.58% |
106.53 |
|
| £20-25K |
10.37% |
10.39% |
99.78 |
|
| £25-30K |
7.25% |
7.77% |
93.23 |
|
| £30-35K |
5.04% |
5.79% |
87.07 |
|
| £35-40K |
3.53% |
4.33% |
81.37 |
|
| £40-45K |
2.49% |
3.27% |
76.13 |
|
| £45-50K |
1.77% |
2.48% |
71.35 |
|
| £50-55K |
1.28% |
1.90% |
67.00 |
|
| £55-60K |
0.93% |
1.47% |
63.02 |
|
| £60-65K |
0.68% |
1.15% |
59.41 |
|
| £65-70K |
0.51% |
0.91% |
56.10 |
|
| £70-75K |
0.38% |
0.72% |
53.08 |
|
| £75-80K |
0.29% |
0.57% |
50.31 |
|
| £80-85K |
0.22% |
0.46% |
47.77 |
|
| £85-90K |
0.17% |
0.37% |
45.44 |
|
| £90-95K |
0.13% |
0.31% |
43.28 |
|
| £95-100K |
0.10% |
0.25% |
41.29 |
|
| £100K + |
0.43% |
1.34% |
31.87 |
|
|
|

|


|
1992-1997
|
1997-2001
|
|
|
|
| Con |
-6.51% |
| Lab |
5.53% |
| LD |
0.90% |
| PC |
-3.19% |
|
| Con |
0.76% |
| Lab |
-12.84% |
| LD |
3.23% |
| PC |
10.27% |
|
|
 |
Peter Hain
Labour hold
|
| Con |
 |
3,310 |
9.45% |
| Lab |
 |
21,253 |
60.69% |
| LD |
 |
3,335 |
9.52% |
| PC |
 |
6,437 |
18.38% |
| Oth |
 |
685 |
1.96% |
| Maj |
 |
14,816 |
42.31% |
| Turn |
 |
35,020 |
62.42% |
|
|
 |
Peter Hain
Labour hold
|
| P |
Gerardo Brienza |
202 |
0.58% |
| LD |
David Davies |
3,335 |
9.52% |
| C |
David Devine |
3,310 |
9.45% |
| L |
Peter Hain |
21,253 |
60.69% |
| PC |
Alun Llywelyn |
6,437 |
18.38% |
| SA |
Huw Pudner |
483 |
1.38% |
|
Candidates representing 6 parties stood for election to this seat.
|
|
 |
Peter Hain
Labour
|
| Con |
 |
3,583 |
8.69% |
| Lab |
 |
30,324 |
73.53% |
| LD |
 |
2,597 |
6.30% |
| PC |
 |
3,344 |
8.11% |
| Ref |
 |
975 |
2.36% |
| Oth |
 |
420 |
1.02% |
| Maj |
 |
26,741 |
64.84% |
| Turn |
 |
41,243 |
74.28% |
|
|
 |
|
Labour
|
| Con |
 |
6,928 |
15.20% |
| Lab |
 |
30,903 |
68.00% |
| LD |
 |
2,467 |
5.40% |
| PC |
 |
5,145 |
11.30% |
| Oth |
|
0 |
0.00% |
| Maj |
 |
23,975 |
52.80% |
| Turn |
 |
45,443 |
79.86% |
|
|
 |
|

|

