|
New Forest East
Conservative hold

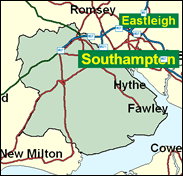
Rather than a bifurcation of the old New Forest seat, this division is actually the successor to Romsey and Waterside without the town of Romsey itself. This means that it is characterised less by stands of carefully conserved trees than by the huge oil refinery at Fawley, and the population is located more in the west shore parishes on Southampton Water such as Hythe and Dibden and Marchwood than in the heart of the forest in older communities like Lyndhurst and Brockenhurst, still less beauty spots like Bucklers Hard and Beaulieu Abbey. Julian Lewis polled 43pc for the Conservatives in 1997, but would have been pressed much harder had the Labour vote declined or even stayed steady, rather than rising by 12pc to 25pc; the Liberal Democrats actually fell back slightly, and unless they can reverse this trend and encourage tactical voting they may even find themselves third next time.

Dr Julian Lewis, elected here in 1997, has been euphemistically described as an ‘oddball’. A tall, thin man with a set smile, extremely precise diction and an obsessional manner, he is a loner who allegedly shreds newspapers so that no-one will know what he has cut out, as befits one who is still fighting the Cold War and the attendant threat to Western security from leftwing unilateralists. With his paranoia now transferred to the European Community, which he sees as a threat to Nato, he ran out of enthusiasm in the Tory leadership ballots when his man, Redwood, made his pact with the Clarkeian devil. Born 1951 into a Jewish family, and educated at Dynevor Grammar School and Balliol College Oxford, and with a doctorate in strategic studies from St Anthony’s College Oxford, he quit as Deputy Director of the Conservative Research Department in 1996 in order to campaign against Europe.
 |
| Wealthy Achievers, Suburban Areas |
24.70% |
14.99% |
164.76 |
|
| Affluent Greys, Rural Communities |
2.83% |
2.13% |
132.91 |
|
| Prosperous Pensioners, Retirement Areas |
3.90% |
2.49% |
156.75 |
|
| Affluent Executives, Family Areas |
13.02% |
4.43% |
294.29 |
|
| Well-Off Workers, Family Areas |
12.75% |
7.27% |
175.31 |
|
| Affluent Urbanites, Town & City Areas |
0.63% |
2.56% |
24.49 |
|
| Prosperous Professionals, Metropolitan Areas |
0.00% |
2.04% |
0.00 |
|
| Better-Off Executives, Inner City Areas |
0.00% |
3.94% |
0.00 |
|
| Comfortable Middle Agers, Mature Home Owning Areas |
19.81% |
13.04% |
151.91 |
|
| Skilled Workers, Home Owning Areas |
7.39% |
12.70% |
58.21 |
|
| New Home Owners, Mature Communities |
7.65% |
8.14% |
93.96 |
|
| White Collar Workers, Better-Off Multi Ethnic Areas |
0.01% |
4.02% |
0.28 |
|
| Older People, Less Prosperous Areas |
1.91% |
3.19% |
59.98 |
|
| Council Estate Residents, Better-Off Homes |
3.04% |
11.31% |
26.85 |
|
| Council Estate Residents, High Unemployment |
0.01% |
3.06% |
0.45 |
|
| Council Estate Residents, Greatest Hardship |
2.17% |
2.52% |
86.27 |
|
| People in Multi-Ethnic, Low-Income Areas |
0.00% |
2.10% |
0.00 |
|
| Unclassified |
0.17% |
0.06% |
277.13 |
|
|
 |
 |
 |
| £0-5K |
6.49% |
9.41% |
68.98 |
|
| £5-10K |
13.79% |
16.63% |
82.93 |
|
| £10-15K |
15.75% |
16.58% |
95.01 |
|
| £15-20K |
14.15% |
13.58% |
104.14 |
|
| £20-25K |
11.48% |
10.39% |
110.42 |
|
| £25-30K |
8.89% |
7.77% |
114.37 |
|
| £30-35K |
6.75% |
5.79% |
116.57 |
|
| £35-40K |
5.09% |
4.33% |
117.50 |
|
| £40-45K |
3.84% |
3.27% |
117.55 |
|
| £45-50K |
2.90% |
2.48% |
117.00 |
|
| £50-55K |
2.21% |
1.90% |
116.06 |
|
| £55-60K |
1.69% |
1.47% |
114.87 |
|
| £60-65K |
1.31% |
1.15% |
113.54 |
|
| £65-70K |
1.02% |
0.91% |
112.14 |
|
| £70-75K |
0.80% |
0.72% |
110.71 |
|
| £75-80K |
0.63% |
0.57% |
109.28 |
|
| £80-85K |
0.50% |
0.46% |
107.89 |
|
| £85-90K |
0.40% |
0.37% |
106.55 |
|
| £90-95K |
0.32% |
0.31% |
105.25 |
|
| £95-100K |
0.26% |
0.25% |
104.01 |
|
| £100K + |
1.31% |
1.34% |
97.56 |
|
|
|

|


|
1992-1997
|
1997-2001
|
|
|
|
| Con |
-10.18% |
| Lab |
12.09% |
| LD |
-1.11% |
|
| Con |
-0.48% |
| Lab |
-3.12% |
| LD |
1.08% |
|
|
 |
Julian Lewis
Conservative hold
|
| Con |
 |
17,902 |
42.44% |
| Lab |
 |
9,141 |
21.67% |
| LD |
 |
14,073 |
33.37% |
| Oth |
 |
1,062 |
2.52% |
| Maj |
 |
3,829 |
9.08% |
| Turn |
 |
42,178 |
63.17% |
|
|
 |
Julian Lewis
Conservative hold
|
| LD |
Brian Dash |
14,073 |
33.37% |
| L |
Alan Goodfellow |
9,141 |
21.67% |
| UK |
William Howe |
1,062 |
2.52% |
| C |
Julian Lewis |
17,902 |
42.44% |
|
Candidates representing 4 parties stood for election to this seat.
|
|
 |
Julian Lewis
Conservative
|
| Con |
 |
21,053 |
42.92% |
| Lab |
 |
12,161 |
24.79% |
| LD |
 |
15,838 |
32.29% |
| Ref |
|
0 |
0.00% |
| Oth |
|
0 |
0.00% |
| Maj |
 |
5,215 |
10.63% |
| Turn |
 |
49,052 |
74.64% |
|
|
 |
|
Conservative
|
| Con |
 |
27,980 |
53.10% |
| Lab |
 |
6,704 |
12.70% |
| LD |
 |
17,632 |
33.40% |
| Oth |
 |
423 |
0.80% |
| Maj |
 |
10,348 |
19.60% |
| Turn |
 |
52,739 |
81.94% |
|
|
 |
|

|

