|
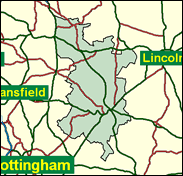
Newark
Conservative gain

Although it only ranks at number 25 on the list of the Conservatives' top targets among Labour seats gained from them in the 1997 General Election, the Nottinghamshire seat of Newark is well worth watching. First, there is the question of the rocky road navigated by the first term MP Fiona Jones, who was accused along with her agent of exceeding election expenses in that campaign. She has come through that trauma, having been cleared on appeal, but Newark remains a highly vulnerable seat. In the June 1999 European elections, if the votes cast are summed to parliamentary constituency level (they were actually cast for regional party lists) the Conservatives were 23.7pc ahead, the highest in any of the 138 seats presently held by Labour in which the Conservatives obtained a plurality in those Euro-contests. Nor have the May local council elections in Newark/Sherwood and Bassetlaw districts been favourable over the two years before the expected date of the next election. The rural parts of this seat are very Conservative indeed, and Labour performs only patchily in the two largest towns, Retford and Newark itself. Fiona Jones must really pull off a Houdini act to maintain her place in the Commons this time.

Fiona Jones, a journalist, born 1957 and convent-educated in Liverpool, who enjoyed a prominent place within an arm’s length of Tony Blair in the famous photograph of Labour’s women MPs in May 1997, was less prominent in the Commons thereafter, where she was dogged by the accusation of false declaration of election expenses. A court found against her in March 1999 and she was expelled from the House, but on appeal in April this verdict was reversed and she was fully reinstated as MP. Fancying his chances will be Conservative Patrick Mercer, son of a former Bishop of Exeter. Born 1956, public school and Oxford-educated (King’s, Chester and Exeter College), he is now a journalist on the BBC Radio Four’s Today Programme, but previously served 25 years with the Sherwood Foresters, including nine tours of Northern Ireland. He is Newark-based, with his wife assisting him in his campaign, he narrowly missed selection for safe Leominster in the wake of the floor-crossing Peter Temple-Morris.
 |
| Wealthy Achievers, Suburban Areas |
22.14% |
14.99% |
147.67 |
|
| Affluent Greys, Rural Communities |
3.11% |
2.13% |
146.20 |
|
| Prosperous Pensioners, Retirement Areas |
2.22% |
2.49% |
89.27 |
|
| Affluent Executives, Family Areas |
2.64% |
4.43% |
59.63 |
|
| Well-Off Workers, Family Areas |
8.76% |
7.27% |
120.39 |
|
| Affluent Urbanites, Town & City Areas |
0.82% |
2.56% |
32.13 |
|
| Prosperous Professionals, Metropolitan Areas |
0.00% |
2.04% |
0.00 |
|
| Better-Off Executives, Inner City Areas |
1.17% |
3.94% |
29.72 |
|
| Comfortable Middle Agers, Mature Home Owning Areas |
12.26% |
13.04% |
94.05 |
|
| Skilled Workers, Home Owning Areas |
18.66% |
12.70% |
146.90 |
|
| New Home Owners, Mature Communities |
11.49% |
8.14% |
141.13 |
|
| White Collar Workers, Better-Off Multi Ethnic Areas |
1.37% |
4.02% |
34.10 |
|
| Older People, Less Prosperous Areas |
5.69% |
3.19% |
178.48 |
|
| Council Estate Residents, Better-Off Homes |
7.99% |
11.31% |
70.62 |
|
| Council Estate Residents, High Unemployment |
0.50% |
3.06% |
16.47 |
|
| Council Estate Residents, Greatest Hardship |
1.10% |
2.52% |
43.82 |
|
| People in Multi-Ethnic, Low-Income Areas |
0.00% |
2.10% |
0.00 |
|
| Unclassified |
0.07% |
0.06% |
113.53 |
|
|
 |
|
|
| £0-5K |
10.85% |
9.41% |
115.23 |
|
| £5-10K |
18.85% |
16.63% |
113.36 |
|
| £10-15K |
18.06% |
16.58% |
108.92 |
|
| £15-20K |
14.09% |
13.58% |
103.74 |
|
| £20-25K |
10.25% |
10.39% |
98.60 |
|
| £25-30K |
7.30% |
7.77% |
93.85 |
|
| £30-35K |
5.19% |
5.79% |
89.60 |
|
| £35-40K |
3.72% |
4.33% |
85.85 |
|
| £40-45K |
2.70% |
3.27% |
82.57 |
|
| £45-50K |
1.98% |
2.48% |
79.70 |
|
| £50-55K |
1.47% |
1.90% |
77.18 |
|
| £55-60K |
1.11% |
1.47% |
74.97 |
|
| £60-65K |
0.84% |
1.15% |
73.01 |
|
| £65-70K |
0.65% |
0.91% |
71.28 |
|
| £70-75K |
0.50% |
0.72% |
69.74 |
|
| £75-80K |
0.39% |
0.57% |
68.36 |
|
| £80-85K |
0.31% |
0.46% |
67.11 |
|
| £85-90K |
0.25% |
0.37% |
65.99 |
|
| £90-95K |
0.20% |
0.31% |
64.96 |
|
| £95-100K |
0.16% |
0.25% |
64.03 |
|
| £100K + |
0.80% |
1.34% |
59.63 |
|
|
|
|


|
1992-1997
|
1997-2001
|
|
|
|
| Con |
-10.99% |
| Lab |
9.41% |
| LD |
-1.53% |
|
| Con |
7.09% |
| Lab |
-7.74% |
| LD |
1.76% |
|
|
|
Patrick Mercer
Conservative gain
|
| Con |
 |
20,983 |
46.50% |
| Lab |
 |
16,910 |
37.47% |
| LD |
 |
5,970 |
13.23% |
| Oth |
 |
1,262 |
2.80% |
| Maj |
 |
4,073 |
9.03% |
| Turn |
|
45,125 |
63.48% |
|
|
|
Patrick Mercer
Conservative gain
|
| LD |
David Harding-Price |
5,970 |
13.23% |
| I |
Donald Haxby |
800 |
1.77% |
| L |
Fiona Jones |
16,910 |
37.47% |
| C |
Patrick Mercer |
20,983 |
46.50% |
| SA |
Ian Thomson |
462 |
1.02% |
|
Candidates representing 5 parties stood for election to this seat.
|
|
|
Fiona Jones
Labour gain
|
| Con |
|
20,480 |
39.41% |
| Lab |
|
23,496 |
45.21% |
| LD |
|
5,960 |
11.47% |
| Ref |
 |
2,035 |
3.92% |
| Oth |
|
0 |
0.00% |
| Maj |
|
3,016 |
5.80% |
| Turn |
|
51,971 |
74.50% |
|
|
|
|
Conservative
|
| Con |
|
28,494 |
50.40% |
| Lab |
|
20,265 |
35.80% |
| LD |
|
7,342 |
13.00% |
| Oth |
|
435 |
0.80% |
| Maj |
|
8,229 |
14.60% |
| Turn |
|
56,536 |
81.52% |
|
|
|
|
|