|
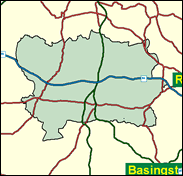
Newbury
Liberal Democrat hold

Having first won Newbury in a by-election caused by the unexpected death of the sitting MP Judith Chaplin in 1993, the Liberal Democrats seem very well established, with an extremely strong local election base, and a tradition of squeezing the Labour vote to just about its lowest level anywhere in Britain. David Rendel garnered an absolute majority of votes in 1997, and must now be regarded as one of the safest of all Liberal Democrat members: perhaps a surprising assertion here in west Berkshire, so far from their traditional outposts in the Celtic fringes. It does go to show how important the contingency of a surprise byelection can be, especially when allied to a much longer reinforcing tradition of local government activism.

David Rendel, the Liberal Democrats’ only Old Etonian MP, until the 3rd Viscount Thurso arrives from Caithness after the election, has been MP here since winning the byelection on a routinely massive 28pc swing in 1993. Born 1949 and educated, after Eton, at Magdalen College Oxford, he was previously an operational analyst with Shell and Esso. He was parachuted into Newbury to plan long-term for a seizure of the seat; his great-uncle had been Liberal MP for Montgomeryshire in the 1880s, with one of his daughter’s married to one of Gladstone’s sons. Rather foolishly, given his very clipped upper class mien, he ran for the Liberal leadership in 1999, polled badly and was thereafter marginalised by Charles Kennedy, having appeared to disparage the new leader’s talented performances on chat shows.
 |
| Wealthy Achievers, Suburban Areas |
33.54% |
14.99% |
223.72 |
|
| Affluent Greys, Rural Communities |
1.72% |
2.13% |
81.01 |
|
| Prosperous Pensioners, Retirement Areas |
1.50% |
2.49% |
60.33 |
|
| Affluent Executives, Family Areas |
5.27% |
4.43% |
119.12 |
|
| Well-Off Workers, Family Areas |
15.65% |
7.27% |
215.16 |
|
| Affluent Urbanites, Town & City Areas |
1.94% |
2.56% |
75.45 |
|
| Prosperous Professionals, Metropolitan Areas |
0.50% |
2.04% |
24.66 |
|
| Better-Off Executives, Inner City Areas |
1.16% |
3.94% |
29.44 |
|
| Comfortable Middle Agers, Mature Home Owning Areas |
18.70% |
13.04% |
143.43 |
|
| Skilled Workers, Home Owning Areas |
5.86% |
12.70% |
46.16 |
|
| New Home Owners, Mature Communities |
5.30% |
8.14% |
65.07 |
|
| White Collar Workers, Better-Off Multi Ethnic Areas |
1.20% |
4.02% |
29.95 |
|
| Older People, Less Prosperous Areas |
1.07% |
3.19% |
33.74 |
|
| Council Estate Residents, Better-Off Homes |
6.03% |
11.31% |
53.35 |
|
| Council Estate Residents, High Unemployment |
0.19% |
3.06% |
6.26 |
|
| Council Estate Residents, Greatest Hardship |
0.00% |
2.52% |
0.00 |
|
| People in Multi-Ethnic, Low-Income Areas |
0.00% |
2.10% |
0.00 |
|
| Unclassified |
0.34% |
0.06% |
550.38 |
|
|
 |
 |
 |
| £0-5K |
5.13% |
9.41% |
54.48 |
|
| £5-10K |
10.55% |
16.63% |
63.40 |
|
| £10-15K |
12.71% |
16.58% |
76.67 |
|
| £15-20K |
12.31% |
13.58% |
90.66 |
|
| £20-25K |
10.82% |
10.39% |
104.07 |
|
| £25-30K |
9.05% |
7.77% |
116.38 |
|
| £30-35K |
7.38% |
5.79% |
127.43 |
|
| £35-40K |
5.95% |
4.33% |
137.23 |
|
| £40-45K |
4.76% |
3.27% |
145.88 |
|
| £45-50K |
3.81% |
2.48% |
153.49 |
|
| £50-55K |
3.05% |
1.90% |
160.22 |
|
| £55-60K |
2.45% |
1.47% |
166.17 |
|
| £60-65K |
1.97% |
1.15% |
171.48 |
|
| £65-70K |
1.60% |
0.91% |
176.23 |
|
| £70-75K |
1.30% |
0.72% |
180.52 |
|
| £75-80K |
1.06% |
0.57% |
184.41 |
|
| £80-85K |
0.87% |
0.46% |
187.97 |
|
| £85-90K |
0.72% |
0.37% |
191.24 |
|
| £90-95K |
0.59% |
0.31% |
194.28 |
|
| £95-100K |
0.49% |
0.25% |
197.10 |
|
| £100K + |
2.86% |
1.34% |
212.59 |
|
|
|

|


|
1992-1997
|
1997-2001
|
|
|
|
| Con |
-18.06% |
| Lab |
-0.60% |
| LD |
15.82% |
|
| Con |
5.64% |
| Lab |
1.43% |
| LD |
-4.68% |
|
|
 |
David Rendel
Liberal Democrat hold
|
| Con |
 |
22,092 |
43.48% |
| Lab |
 |
3,523 |
6.93% |
| LD |
 |
24,507 |
48.24% |
| Oth |
 |
685 |
1.35% |
| Maj |
 |
2,415 |
4.75% |
| Turn |
 |
50,807 |
67.30% |
|
|
 |
David Rendel
Liberal Democrat hold
|
| C |
Richard Benyon |
22,092 |
43.48% |
| L |
Steve Billcliffe |
3,523 |
6.93% |
| UK |
Delphine Gray-Fisk |
685 |
1.35% |
| LD |
David Rendel |
24,507 |
48.24% |
|
Candidates representing 4 parties stood for election to this seat.
|
|
 |
David Rendel
Liberal Democrat gain
|
| Con |
 |
21,370 |
37.84% |
| Lab |
 |
3,107 |
5.50% |
| LD |
 |
29,887 |
52.92% |
| Ref |
 |
992 |
1.76% |
| Oth |
 |
1,120 |
1.98% |
| Maj |
 |
8,517 |
15.08% |
| Turn |
 |
56,476 |
76.65% |
|
|
 |
|
Conservative
|
| Con |
 |
32,898 |
55.90% |
| Lab |
 |
3,584 |
6.10% |
| LD |
 |
21,841 |
37.10% |
| Oth |
 |
539 |
0.90% |
| Maj |
 |
11,057 |
18.80% |
| Turn |
 |
58,862 |
82.79% |
|
|
 |
|

|

