|
Newcastle-under-Lyme
Labour hold

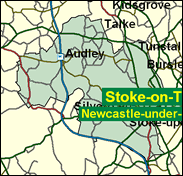
Though once deemed typical enough for a team of political scientists (Bealey, Blondel and McCann) to write a study called Constituency Politics about it, the town and constituency of Newcastle under Lyme in the Potteries, though still mixed, is firmly on the Labour side of average. Their majority slipped under John Golding (MP 1970-86) to 3,000 at its lowest point, and under his successor his wife Llin (MP 1986-2001) to 800 in the byelection following his resignation, but that was over the Liberal Democrats, who have steadily fallen back to third place, and the Conservatives were over 17,000 behind in 1997.

Labour has replaced hard bitten Llyn Golding here with Paul Farrelly, the City Editor of The Observer. A local boy made good, he was born in 1962, educated at Wolstanton Grammar School and St. Edmund Hall Oxford. A former Reuters correspondent and corporate financer at Barclays de Zoete Wedd, he joined The Observer in 1997 after two years at the Independent on Sunday. Currently chairman of a campaign on NHS provision in North Staffordshire, he recalls his Irish immigrant father’s early death from strokes following loss of his job after the Tory-privatisation of British Gas. Albeit with strong local roots, which he stressed, he is also an example of a metropolitan parachutee, selected for a safe Labour seat by an OMOV system usually favouring local councillors. His son John also bears the redolent name of "Josiah" - recalling Newcastle under Lyme's first Labour MP. Colonel Josiah Wedgwood.
 |
| Wealthy Achievers, Suburban Areas |
9.45% |
14.99% |
62.99 |
|
| Affluent Greys, Rural Communities |
0.00% |
2.13% |
0.00 |
|
| Prosperous Pensioners, Retirement Areas |
0.23% |
2.49% |
9.11 |
|
| Affluent Executives, Family Areas |
4.79% |
4.43% |
108.21 |
|
| Well-Off Workers, Family Areas |
5.07% |
7.27% |
69.73 |
|
| Affluent Urbanites, Town & City Areas |
0.64% |
2.56% |
24.77 |
|
| Prosperous Professionals, Metropolitan Areas |
0.00% |
2.04% |
0.00 |
|
| Better-Off Executives, Inner City Areas |
0.96% |
3.94% |
24.33 |
|
| Comfortable Middle Agers, Mature Home Owning Areas |
14.12% |
13.04% |
108.31 |
|
| Skilled Workers, Home Owning Areas |
28.23% |
12.70% |
222.26 |
|
| New Home Owners, Mature Communities |
16.36% |
8.14% |
200.89 |
|
| White Collar Workers, Better-Off Multi Ethnic Areas |
1.81% |
4.02% |
45.00 |
|
| Older People, Less Prosperous Areas |
5.59% |
3.19% |
175.55 |
|
| Council Estate Residents, Better-Off Homes |
9.70% |
11.31% |
85.72 |
|
| Council Estate Residents, High Unemployment |
1.20% |
3.06% |
39.29 |
|
| Council Estate Residents, Greatest Hardship |
1.86% |
2.52% |
73.80 |
|
| People in Multi-Ethnic, Low-Income Areas |
0.00% |
2.10% |
0.00 |
|
| Unclassified |
0.00% |
0.06% |
0.00 |
|
|
 |
 |
 |
| £0-5K |
10.52% |
9.41% |
111.74 |
|
| £5-10K |
19.05% |
16.63% |
114.55 |
|
| £10-15K |
18.33% |
16.58% |
110.58 |
|
| £15-20K |
14.28% |
13.58% |
105.12 |
|
| £20-25K |
10.35% |
10.39% |
99.60 |
|
| £25-30K |
7.35% |
7.77% |
94.48 |
|
| £30-35K |
5.20% |
5.79% |
89.86 |
|
| £35-40K |
3.71% |
4.33% |
85.72 |
|
| £40-45K |
2.68% |
3.27% |
82.04 |
|
| £45-50K |
1.96% |
2.48% |
78.77 |
|
| £50-55K |
1.44% |
1.90% |
75.85 |
|
| £55-60K |
1.08% |
1.47% |
73.26 |
|
| £60-65K |
0.82% |
1.15% |
70.94 |
|
| £65-70K |
0.62% |
0.91% |
68.87 |
|
| £70-75K |
0.48% |
0.72% |
67.01 |
|
| £75-80K |
0.38% |
0.57% |
65.33 |
|
| £80-85K |
0.30% |
0.46% |
63.82 |
|
| £85-90K |
0.23% |
0.37% |
62.45 |
|
| £90-95K |
0.19% |
0.31% |
61.20 |
|
| £95-100K |
0.15% |
0.25% |
60.07 |
|
| £100K + |
0.74% |
1.34% |
54.69 |
|
|
|

|


|
1992-1997
|
1997-2001
|
|
|
|
| Con |
-8.15% |
| Lab |
8.57% |
| LD |
-7.94% |
|
| Con |
6.13% |
| Lab |
-3.07% |
| LD |
1.54% |
|
|
 |
Paul Farrelly
Labour hold
|
| Con |
 |
10,664 |
27.57% |
| Lab |
 |
20,650 |
53.40% |
| LD |
 |
5,993 |
15.50% |
| Oth |
 |
1,367 |
3.53% |
| Maj |
 |
9,986 |
25.82% |
| Turn |
 |
38,674 |
58.83% |
|
|
 |
Paul Farrelly
Labour hold
|
| L |
Paul Farrelly |
20,650 |
53.40% |
| C |
Mike Flynn |
10,664 |
27.57% |
| Ind |
Robert Fyson |
773 |
2.00% |
| UK |
Paul Godfrey |
594 |
1.54% |
| LD |
Jerry Roodhouse |
5,993 |
15.50% |
|
Candidates representing 5 parties stood for election to this seat.
|
|
 |
Llin Goulding
Labour
|
| Con |
 |
10,537 |
21.45% |
| Lab |
 |
27,743 |
56.47% |
| LD |
 |
6,858 |
13.96% |
| Ref |
 |
1,510 |
3.07% |
| Oth |
 |
2,481 |
5.05% |
| Maj |
 |
17,206 |
35.02% |
| Turn |
 |
49,129 |
73.67% |
|
|
 |
|
Labour
|
| Con |
 |
15,813 |
29.60% |
| Lab |
 |
25,652 |
47.90% |
| LD |
 |
11,727 |
21.90% |
| Oth |
 |
314 |
0.60% |
| Maj |
 |
9,839 |
18.40% |
| Turn |
 |
53,506 |
79.98% |
|
|
 |
|

|

