|
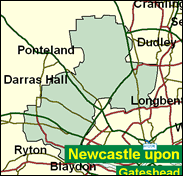
Newcastle upon Tyne North
Labour hold

Although there have been both Conservative and, more recently, Liberal Democrat successes here in council elections (Castle, Grange and South Gosforth wards in the far north of the seat along and besides the A1), the nationwide move to Labour in 1997 makes this look like another massively safe seat in the Geordie 'capital'. Almost exactly half of all the households here in this seat in the north east of England earn less than £15,000 a year, a stark contrast with the south east. This is as good as indication as any of the low standard of living - or to put it more positively, also to some extent the low cost of living - in this proud province.

Doug Henderson, elected here in 1987, covered foreign affairs and defence as a middle rank minister until being dropped in 1999. One of a score of itinerant Scots in English Labour seats, he rose as a GMB union official. Wiry and ex-moustachioed and unflatteringly dubbed in The Times as amongst those who were "too talentless even to be nearly-men", he was born 1949, attended Waid Academy, Fife and Strathclyde University, and is an obsessive jogger.
 |
| Wealthy Achievers, Suburban Areas |
6.36% |
14.99% |
42.40 |
|
| Affluent Greys, Rural Communities |
0.00% |
2.13% |
0.00 |
|
| Prosperous Pensioners, Retirement Areas |
1.14% |
2.49% |
45.76 |
|
| Affluent Executives, Family Areas |
4.07% |
4.43% |
91.94 |
|
| Well-Off Workers, Family Areas |
11.57% |
7.27% |
159.12 |
|
| Affluent Urbanites, Town & City Areas |
1.29% |
2.56% |
50.33 |
|
| Prosperous Professionals, Metropolitan Areas |
1.00% |
2.04% |
49.06 |
|
| Better-Off Executives, Inner City Areas |
0.16% |
3.94% |
3.94 |
|
| Comfortable Middle Agers, Mature Home Owning Areas |
18.02% |
13.04% |
138.20 |
|
| Skilled Workers, Home Owning Areas |
7.22% |
12.70% |
56.86 |
|
| New Home Owners, Mature Communities |
15.96% |
8.14% |
196.04 |
|
| White Collar Workers, Better-Off Multi Ethnic Areas |
0.44% |
4.02% |
11.03 |
|
| Older People, Less Prosperous Areas |
5.23% |
3.19% |
164.18 |
|
| Council Estate Residents, Better-Off Homes |
18.65% |
11.31% |
164.85 |
|
| Council Estate Residents, High Unemployment |
5.95% |
3.06% |
194.42 |
|
| Council Estate Residents, Greatest Hardship |
2.93% |
2.52% |
116.33 |
|
| People in Multi-Ethnic, Low-Income Areas |
0.00% |
2.10% |
0.00 |
|
| Unclassified |
0.01% |
0.06% |
9.44 |
|
|
 |
 |
 |
| £0-5K |
12.18% |
9.41% |
129.37 |
|
| £5-10K |
19.68% |
16.63% |
118.31 |
|
| £10-15K |
18.02% |
16.58% |
108.67 |
|
| £15-20K |
13.76% |
13.58% |
101.27 |
|
| £20-25K |
9.92% |
10.39% |
95.49 |
|
| £25-30K |
7.06% |
7.77% |
90.77 |
|
| £30-35K |
5.03% |
5.79% |
86.76 |
|
| £35-40K |
3.61% |
4.33% |
83.22 |
|
| £40-45K |
2.61% |
3.27% |
80.03 |
|
| £45-50K |
1.91% |
2.48% |
77.10 |
|
| £50-55K |
1.42% |
1.90% |
74.39 |
|
| £55-60K |
1.06% |
1.47% |
71.87 |
|
| £60-65K |
0.80% |
1.15% |
69.51 |
|
| £65-70K |
0.61% |
0.91% |
67.30 |
|
| £70-75K |
0.47% |
0.72% |
65.22 |
|
| £75-80K |
0.36% |
0.57% |
63.26 |
|
| £80-85K |
0.28% |
0.46% |
61.42 |
|
| £85-90K |
0.22% |
0.37% |
59.68 |
|
| £90-95K |
0.18% |
0.31% |
58.03 |
|
| £95-100K |
0.14% |
0.25% |
56.48 |
|
| £100K + |
0.65% |
1.34% |
48.33 |
|
|
|

|


|
1992-1997
|
1997-2001
|
|
|
|
| Con |
-12.36% |
| Lab |
12.78% |
| LD |
-4.26% |
|
| Con |
0.97% |
| Lab |
-2.04% |
| LD |
4.90% |
|
|
 |
Doug Henderson
Labour hold
|
| Con |
 |
7,424 |
20.41% |
| Lab |
 |
21,874 |
60.15% |
| LD |
 |
7,070 |
19.44% |
| Oth |
|
0 |
0.00% |
| Maj |
 |
14,450 |
39.73% |
| Turn |
 |
36,368 |
57.54% |
|
|
 |
Doug Henderson
Labour hold
|
| L |
Doug Henderson |
21,874 |
60.15% |
| C |
Phillip Smith |
7,424 |
20.41% |
| LD |
Graham Soult |
7,070 |
19.44% |
|
Candidates representing 3 parties stood for election to this seat.
|
|
 |
Doug Henderson
Labour
|
| Con |
 |
8,793 |
19.44% |
| Lab |
 |
28,125 |
62.18% |
| LD |
 |
6,578 |
14.54% |
| Ref |
 |
1,733 |
3.83% |
| Oth |
|
0 |
0.00% |
| Maj |
 |
19,332 |
42.74% |
| Turn |
 |
45,229 |
69.20% |
|
|
 |
|
Labour
|
| Con |
 |
16,175 |
31.80% |
| Lab |
 |
25,121 |
49.40% |
| LD |
 |
9,542 |
18.80% |
| Oth |
|
0 |
0.00% |
| Maj |
 |
8,946 |
17.60% |
| Turn |
 |
50,838 |
75.48% |
|
|
 |
|

|

