|
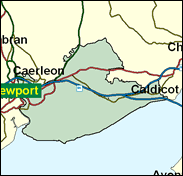
Newport East
Labour hold

In 1997 the Yorkshire and NUM miners leader Arthur Scargill presented himself for election to parliament for the first time in a long and controversial career. He did not stand anywhere near his home base in Barnsley, but in Newport East in South Wales. This seemed an odd choice, for although strongly associated with heavy industry, in particular steel through its giant Llanwern works, Newport has no direct connections with coal. The explanation was that the founder and leader of the Socialist Labour Party wished to make a gesture against the selection in this ancestral Labour seat of the Conservative member for Stratford on Avon in the previous Parliament, the defector Alan Howarth, who was thus granted a safe seat in an area unfamiliar to him. Scargill ended up with 1,951 votes. Howarth got 21,481.

Alan Howarth, Labour MP here since being airlifted in at the last minute in 1997, is the first of the small batch of Conservative MPs who did a Sir Shortly Floorcross in reverse by showing it was perfectly possible for public school and Oxbridge Tory MPs to go Labour. A former Thatcherite education minister, he was elected for Stratford-upon-Avon in 1983 after a short Central Office career, but as a liberal on social policy trailed his anxieties in The Guardian and crossed the floor in 1995. Born 1944, son of Tom Howarth, High Master of St. Paul's School, he was educated at Rugby and King's, Cambridge. A tall, introverted man of austere look, he now has the luckless task of watching the dismantling of the huge Llanwern steelworks whilst serving, scarcely congruently, as Arts Minister.
 |
| Wealthy Achievers, Suburban Areas |
13.06% |
14.99% |
87.07 |
|
| Affluent Greys, Rural Communities |
0.27% |
2.13% |
12.52 |
|
| Prosperous Pensioners, Retirement Areas |
0.04% |
2.49% |
1.74 |
|
| Affluent Executives, Family Areas |
7.06% |
4.43% |
159.53 |
|
| Well-Off Workers, Family Areas |
3.74% |
7.27% |
51.45 |
|
| Affluent Urbanites, Town & City Areas |
0.18% |
2.56% |
7.01 |
|
| Prosperous Professionals, Metropolitan Areas |
0.00% |
2.04% |
0.00 |
|
| Better-Off Executives, Inner City Areas |
0.18% |
3.94% |
4.56 |
|
| Comfortable Middle Agers, Mature Home Owning Areas |
13.67% |
13.04% |
104.82 |
|
| Skilled Workers, Home Owning Areas |
29.36% |
12.70% |
231.12 |
|
| New Home Owners, Mature Communities |
5.46% |
8.14% |
67.01 |
|
| White Collar Workers, Better-Off Multi Ethnic Areas |
2.68% |
4.02% |
66.67 |
|
| Older People, Less Prosperous Areas |
1.74% |
3.19% |
54.73 |
|
| Council Estate Residents, Better-Off Homes |
15.91% |
11.31% |
140.70 |
|
| Council Estate Residents, High Unemployment |
2.06% |
3.06% |
67.21 |
|
| Council Estate Residents, Greatest Hardship |
2.96% |
2.52% |
117.39 |
|
| People in Multi-Ethnic, Low-Income Areas |
1.64% |
2.10% |
77.95 |
|
| Unclassified |
0.00% |
0.06% |
0.00 |
|
|
 |
 |
 |
| £0-5K |
9.24% |
9.41% |
98.16 |
|
| £5-10K |
18.08% |
16.63% |
108.68 |
|
| £10-15K |
18.26% |
16.58% |
110.16 |
|
| £15-20K |
14.61% |
13.58% |
107.57 |
|
| £20-25K |
10.73% |
10.39% |
103.20 |
|
| £25-30K |
7.64% |
7.77% |
98.29 |
|
| £30-35K |
5.41% |
5.79% |
93.46 |
|
| £35-40K |
3.86% |
4.33% |
88.98 |
|
| £40-45K |
2.77% |
3.27% |
84.96 |
|
| £45-50K |
2.02% |
2.48% |
81.40 |
|
| £50-55K |
1.49% |
1.90% |
78.27 |
|
| £55-60K |
1.11% |
1.47% |
75.53 |
|
| £60-65K |
0.84% |
1.15% |
73.13 |
|
| £65-70K |
0.64% |
0.91% |
71.02 |
|
| £70-75K |
0.50% |
0.72% |
69.16 |
|
| £75-80K |
0.39% |
0.57% |
67.52 |
|
| £80-85K |
0.31% |
0.46% |
66.06 |
|
| £85-90K |
0.24% |
0.37% |
64.75 |
|
| £90-95K |
0.19% |
0.31% |
63.58 |
|
| £95-100K |
0.16% |
0.25% |
62.53 |
|
| £100K + |
0.78% |
1.34% |
57.91 |
|
|
|

|


|
1992-1997
|
1997-2001
|
|
|
|
| Con |
-10.04% |
| Lab |
2.65% |
| LD |
-1.49% |
| PC |
1.94% |
|
| Con |
1.80% |
| Lab |
-2.93% |
| LD |
3.63% |
| PC |
2.92% |
|
|
 |
Alan Howarth
Labour hold
|
| Con |
 |
7,246 |
23.16% |
| Lab |
 |
17,120 |
54.73% |
| LD |
 |
4,394 |
14.05% |
| PC |
 |
1,519 |
4.86% |
| Oth |
 |
1,003 |
3.21% |
| Maj |
 |
9,874 |
31.56% |
| Turn |
 |
31,282 |
55.74% |
|
|
 |
Alan Howarth
Labour hold
|
| PC |
Madoc Batcup |
1,519 |
4.86% |
| LD |
Alistair Cameron |
4,394 |
14.05% |
| CM |
Robert Griffiths |
173 |
0.55% |
| L |
Alan Howarth |
17,120 |
54.73% |
| C |
Ian Oakley |
7,246 |
23.16% |
| UK |
Neal Reynolds |
410 |
1.31% |
| SL |
Liz Screen |
420 |
1.34% |
|
Candidates representing 7 parties stood for election to this seat.
|
|
 |
Roy Hughes
Labour
|
| Con |
 |
7,958 |
21.36% |
| Lab |
 |
21,481 |
57.65% |
| LD |
 |
3,880 |
10.41% |
| PC |
 |
721 |
1.94% |
| Ref |
 |
1,267 |
3.40% |
| Oth |
 |
1,951 |
5.24% |
| Maj |
 |
13,523 |
36.30% |
| Turn |
 |
37,258 |
73.06% |
|
|
 |
|
Labour
|
| Con |
 |
13,151 |
31.40% |
| Lab |
 |
23,050 |
55.00% |
| LD |
 |
4,991 |
11.90% |
| Oth |
 |
716 |
1.70% |
| Maj |
 |
9,899 |
23.60% |
| Turn |
 |
41,908 |
81.25% |
|
|
 |
|

|

