|
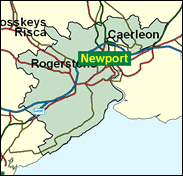
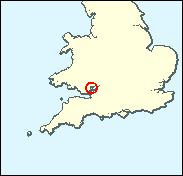
Newport West
Labour hold

Although traditionally the less strongly Labour half of Newport, the majority in West is now almost exactly the same in percentage terms as that in the Newport East seat (36.2pc compared with 36.3pc). This may be due to the fact that the defecting Conservative MP Alan Howarth only increased the Labour share of the vote in East by 2.7pc in 1997, one of the lowest improvements anywhere, while here the left winger Paul Flynn, free of Socialist Labour opposition, did almost five per cent better (just about the figure that Arthur Scargill recorded in Newport East).

Paul Flynn, fluent, deep-voiced, bearded garden gnome replica and awkward squaddie, resisted "Old Labour vote-rigging and New Labour control freakery" over the election of Labour's Welsh Assembly leader and voted against the government on Murdoch's predatory pricing, the prime minister's power to nominate life peers, incapacity and disability benefit cuts, jury trial curbs, and air traffic control privatisation. Born 1935 and like a growing number of Welsh Labour MPs, of part Irish parentage, he attended St. Illtyd's (RC) College, Cardiff and Cardiff University, worked as an industrial chemist in the steel industry and was elected here in 1983. He campaigns against bull bars on vehicles and for the decriminalisation of soft drugs.
 |
| Wealthy Achievers, Suburban Areas |
15.08% |
14.99% |
100.57 |
|
| Affluent Greys, Rural Communities |
0.00% |
2.13% |
0.00 |
|
| Prosperous Pensioners, Retirement Areas |
1.85% |
2.49% |
74.51 |
|
| Affluent Executives, Family Areas |
5.23% |
4.43% |
118.30 |
|
| Well-Off Workers, Family Areas |
7.24% |
7.27% |
99.61 |
|
| Affluent Urbanites, Town & City Areas |
2.69% |
2.56% |
104.74 |
|
| Prosperous Professionals, Metropolitan Areas |
0.47% |
2.04% |
22.92 |
|
| Better-Off Executives, Inner City Areas |
3.16% |
3.94% |
80.13 |
|
| Comfortable Middle Agers, Mature Home Owning Areas |
13.47% |
13.04% |
103.31 |
|
| Skilled Workers, Home Owning Areas |
10.40% |
12.70% |
81.89 |
|
| New Home Owners, Mature Communities |
7.09% |
8.14% |
87.03 |
|
| White Collar Workers, Better-Off Multi Ethnic Areas |
4.45% |
4.02% |
110.66 |
|
| Older People, Less Prosperous Areas |
4.59% |
3.19% |
144.06 |
|
| Council Estate Residents, Better-Off Homes |
15.82% |
11.31% |
139.88 |
|
| Council Estate Residents, High Unemployment |
2.75% |
3.06% |
89.90 |
|
| Council Estate Residents, Greatest Hardship |
5.01% |
2.52% |
198.79 |
|
| People in Multi-Ethnic, Low-Income Areas |
0.69% |
2.10% |
33.03 |
|
| Unclassified |
0.00% |
0.06% |
0.00 |
|
|
 |
|
|
| £0-5K |
10.16% |
9.41% |
107.91 |
|
| £5-10K |
17.84% |
16.63% |
107.27 |
|
| £10-15K |
17.37% |
16.58% |
104.78 |
|
| £15-20K |
13.83% |
13.58% |
101.81 |
|
| £20-25K |
10.26% |
10.39% |
98.75 |
|
| £25-30K |
7.45% |
7.77% |
95.79 |
|
| £30-35K |
5.39% |
5.79% |
92.98 |
|
| £35-40K |
3.91% |
4.33% |
90.34 |
|
| £40-45K |
2.87% |
3.27% |
87.86 |
|
| £45-50K |
2.12% |
2.48% |
85.51 |
|
| £50-55K |
1.59% |
1.90% |
83.29 |
|
| £55-60K |
1.20% |
1.47% |
81.19 |
|
| £60-65K |
0.91% |
1.15% |
79.18 |
|
| £65-70K |
0.70% |
0.91% |
77.26 |
|
| £70-75K |
0.54% |
0.72% |
75.43 |
|
| £75-80K |
0.42% |
0.57% |
73.68 |
|
| £80-85K |
0.33% |
0.46% |
71.99 |
|
| £85-90K |
0.26% |
0.37% |
70.38 |
|
| £90-95K |
0.21% |
0.31% |
68.83 |
|
| £95-100K |
0.17% |
0.25% |
67.34 |
|
| £100K + |
0.79% |
1.34% |
58.97 |
|
|
|
|


|
1992-1997
|
1997-2001
|
|
|
|
| Con |
-11.64% |
| Lab |
7.42% |
| LD |
0.22% |
| PC |
1.61% |
|
| Con |
1.83% |
| Lab |
-7.79% |
| LD |
1.96% |
| PC |
5.55% |
|
|
|
Paul Flynn
Labour hold
|
| Con |
 |
9,185 |
26.20% |
| Lab |
 |
18,489 |
52.73% |
| LD |
 |
4,095 |
11.68% |
| PC |
 |
2,510 |
7.16% |
| Oth |
 |
784 |
2.24% |
| Maj |
 |
9,304 |
26.54% |
| Turn |
|
35,063 |
58.69% |
|
|
|
Paul Flynn
Labour hold
|
| BNP |
Terry Cavill |
278 |
0.79% |
| L |
Paul Flynn |
18,489 |
52.73% |
| UK |
Hugh Moelwyn-Hughes |
506 |
1.44% |
| C |
William Morgan |
9,185 |
26.20% |
| PC |
Anthony Salkeld |
2,510 |
7.16% |
| LD |
Veronica Watkins |
4,095 |
11.68% |
|
Candidates representing 6 parties stood for election to this seat.
|
|
|
Paul Flynn
Labour
|
| Con |
|
9,794 |
24.36% |
| Lab |
|
24,331 |
60.52% |
| LD |
|
3,907 |
9.72% |
| PC |
|
648 |
1.61% |
| Ref |
 |
1,199 |
2.98% |
| Oth |
|
323 |
0.80% |
| Maj |
|
14,537 |
36.16% |
| Turn |
|
40,202 |
74.57% |
|
|
|
|
Labour
|
| Con |
|
16,360 |
36.00% |
| Lab |
|
24,139 |
53.10% |
| LD |
|
4,296 |
9.50% |
| Oth |
|
653 |
1.40% |
| Maj |
|
7,779 |
17.10% |
| Turn |
|
45,448 |
82.19% |
|
|
|
|
|