|
Norfolk Mid
Conservative hold

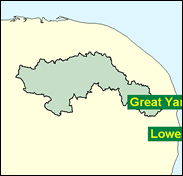
This seat includes a part of the Broads, and a few small towns such as East Dereham, Aylsham and Acle, and a chunk of Norwich suburbs, togther with a large number of villages spread across the interior of the big east Anglian county. The latter element may well have saved Keith Simpson, for he held on against a larger than average swing for Norfolk by only 1,336 votes against Labour in the 1997 General Election. He may come to appreciate a personal incumbency vote such as that his popular predecessor Richard Ryder held, for the Conservatives can regard no seat in either Norfolk or Suffolk as rock solid for them despite Labour's aberrant rural tradition in the county. This time round, Labour's standard is again borne by Daniel Zeichner, who benefited from the 13 per cent swing against the Tories in this seat in 1997.

Keith Simpson, a Conservative Whip and earlier a Defence spokesman, was elected in 1997 as one of the handful of Clarke supporters in that intake of Tory MPs, despite his own concealed doubts over the single currency. A burly moustachioed, jovial man in the manner of a Mace grocer, he was born in 1949 and educated at Thorpe Grammar School, Hull University and King's College London. He lectured at Sandhurst and Shrivenham and authored books on 'the Old Contemptibles' and the Waffen SS, with a look about him appropriately more of the former than of the latter. Labour's Daniel Zeichner, a former researcher to John Garrett MP, fought the seat in 1997 and was educated at Trinity School, Croydon and King's College Cambridge.
 |
| Wealthy Achievers, Suburban Areas |
29.86% |
14.99% |
199.14 |
|
| Affluent Greys, Rural Communities |
7.36% |
2.13% |
346.02 |
|
| Prosperous Pensioners, Retirement Areas |
3.12% |
2.49% |
125.65 |
|
| Affluent Executives, Family Areas |
2.18% |
4.43% |
49.34 |
|
| Well-Off Workers, Family Areas |
7.58% |
7.27% |
104.18 |
|
| Affluent Urbanites, Town & City Areas |
0.03% |
2.56% |
1.03 |
|
| Prosperous Professionals, Metropolitan Areas |
0.00% |
2.04% |
0.00 |
|
| Better-Off Executives, Inner City Areas |
0.00% |
3.94% |
0.00 |
|
| Comfortable Middle Agers, Mature Home Owning Areas |
34.72% |
13.04% |
266.26 |
|
| Skilled Workers, Home Owning Areas |
2.76% |
12.70% |
21.71 |
|
| New Home Owners, Mature Communities |
9.52% |
8.14% |
116.90 |
|
| White Collar Workers, Better-Off Multi Ethnic Areas |
0.32% |
4.02% |
7.91 |
|
| Older People, Less Prosperous Areas |
1.16% |
3.19% |
36.57 |
|
| Council Estate Residents, Better-Off Homes |
1.28% |
11.31% |
11.29 |
|
| Council Estate Residents, High Unemployment |
0.12% |
3.06% |
3.86 |
|
| Council Estate Residents, Greatest Hardship |
0.00% |
2.52% |
0.00 |
|
| People in Multi-Ethnic, Low-Income Areas |
0.00% |
2.10% |
0.00 |
|
| Unclassified |
0.00% |
0.06% |
0.00 |
|
|
 |
 |
 |
| £0-5K |
8.96% |
9.41% |
95.22 |
|
| £5-10K |
17.13% |
16.63% |
103.00 |
|
| £10-15K |
17.73% |
16.58% |
106.95 |
|
| £15-20K |
14.66% |
13.58% |
107.94 |
|
| £20-25K |
11.10% |
10.39% |
106.79 |
|
| £25-30K |
8.11% |
7.77% |
104.26 |
|
| £30-35K |
5.84% |
5.79% |
100.90 |
|
| £35-40K |
4.21% |
4.33% |
97.13 |
|
| £40-45K |
3.04% |
3.27% |
93.20 |
|
| £45-50K |
2.22% |
2.48% |
89.27 |
|
| £50-55K |
1.63% |
1.90% |
85.46 |
|
| £55-60K |
1.21% |
1.47% |
81.81 |
|
| £60-65K |
0.90% |
1.15% |
78.36 |
|
| £65-70K |
0.68% |
0.91% |
75.11 |
|
| £70-75K |
0.52% |
0.72% |
72.07 |
|
| £75-80K |
0.40% |
0.57% |
69.23 |
|
| £80-85K |
0.31% |
0.46% |
66.57 |
|
| £85-90K |
0.24% |
0.37% |
64.10 |
|
| £90-95K |
0.19% |
0.31% |
61.79 |
|
| £95-100K |
0.15% |
0.25% |
59.63 |
|
| £100K + |
0.66% |
1.34% |
48.91 |
|
|
|

|


|
1992-1997
|
1997-2001
|
|
|
|
| Con |
-15.02% |
| Lab |
11.15% |
| LD |
-4.00% |
|
| Con |
5.49% |
| Lab |
-1.62% |
| LD |
-0.39% |
|
|
 |
Keith Simpson
Conservative hold
|
| Con |
 |
23,519 |
45.07% |
| Lab |
 |
18,597 |
35.63% |
| LD |
 |
7,621 |
14.60% |
| Oth |
 |
2,451 |
4.70% |
| Maj |
 |
4,922 |
9.43% |
| Turn |
 |
52,188 |
69.67% |
|
|
 |
Keith Simpson
Conservative hold
|
| UK |
John Agnew |
1,333 |
2.55% |
| LD |
Vivienne Clifford-Jackson |
7,621 |
14.60% |
| G |
Peter Reeve |
1,118 |
2.14% |
| C |
Keith Simpson |
23,519 |
45.07% |
| L |
Daniel Zeichner |
18,597 |
35.63% |
|
Candidates representing 5 parties stood for election to this seat.
|
|
 |
Keith Simpson
Conservative
|
| Con |
 |
22,739 |
39.58% |
| Lab |
 |
21,403 |
37.25% |
| LD |
 |
8,617 |
15.00% |
| Ref |
 |
3,229 |
5.62% |
| Oth |
 |
1,469 |
2.56% |
| Maj |
 |
1,336 |
2.33% |
| Turn |
 |
57,457 |
76.29% |
|
|
 |
|
Conservative
|
| Con |
 |
32,481 |
54.60% |
| Lab |
 |
15,537 |
26.10% |
| LD |
 |
11,316 |
19.00% |
| Oth |
 |
209 |
0.40% |
| Maj |
 |
16,944 |
28.50% |
| Turn |
 |
59,543 |
83.62% |
|
|
 |
|

|

