|
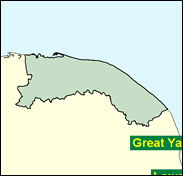
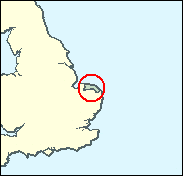
Norfolk North
Liberal Democrat gain

Watch out for a possible surprise Liberal Democrat gain in North Norfolk. Due to boundary changes, it was not clear before the 1997 election which party an anti-Conservative voter should pick; after all, there is little tradition of Liberal success here, or in the large East Anglian county at all, whereas Labour, with its unusual Norfolk rural tradition based largely on a high rate of agricultural trade union membership and activism, won a similar seat from 1945 right through to 1970. Yet it was Norman Lamb for the Lib Dems who pressed David Prior, the replacement for the long-serving Ralph Howell, to a majority of just 1,293. Labour were clearly third, but polled a quarter of the vote, no fewer than 14,736 votes, the most obviously vulnerable to a tactical squeeze and any clandestine arrangement between the non-Tory parties anywhere in England. Prior may well have time to build up a personal vote now, but that Labour percentage should be critical; if it goes down, ironically it is the Conservatives who should emerge as the big losers here.

David Prior, a multi-faceted company director, son of Jim, but without physical or 'One Nation' ideological resemblance, was elected in 1997. He was born 1954, educated at Charterhouse and Pembroke College Cambridge, and qualified as a barrister but never practised. Though claiming "always" to have been pro-European, he voted against the Amsterdam Treaty, but as Conservative Party Deputy Chairman and Chief Executive since 1999, he is the most senior Tory to vote consistently for legalising homosexual sex at 16. The Liberal Democrats, with their candidate Norman Lamb, are targeting this seat on the basis of his good second place in 1997, amid rumours of a tacit Lib-Lab pact covering this seat and neighbouring NW Norfolk. A solicitor specialising in employment law, Norman Lamb was born in 1967, the son of a UEA academic climatologist, and educated at Wymondham College, Leicester University and City of London Polytechnic. Keen on a decentralised version of the EU, fresh-faced and boyish-looking, he will hope his expertise in employment law lands him a job here.
 |
| Wealthy Achievers, Suburban Areas |
5.90% |
14.99% |
39.37 |
|
| Affluent Greys, Rural Communities |
22.17% |
2.13% |
1,042.89 |
|
| Prosperous Pensioners, Retirement Areas |
16.76% |
2.49% |
674.22 |
|
| Affluent Executives, Family Areas |
1.87% |
4.43% |
42.31 |
|
| Well-Off Workers, Family Areas |
1.12% |
7.27% |
15.39 |
|
| Affluent Urbanites, Town & City Areas |
0.00% |
2.56% |
0.00 |
|
| Prosperous Professionals, Metropolitan Areas |
0.00% |
2.04% |
0.00 |
|
| Better-Off Executives, Inner City Areas |
0.05% |
3.94% |
1.28 |
|
| Comfortable Middle Agers, Mature Home Owning Areas |
26.13% |
13.04% |
200.37 |
|
| Skilled Workers, Home Owning Areas |
4.94% |
12.70% |
38.87 |
|
| New Home Owners, Mature Communities |
15.38% |
8.14% |
188.82 |
|
| White Collar Workers, Better-Off Multi Ethnic Areas |
1.63% |
4.02% |
40.55 |
|
| Older People, Less Prosperous Areas |
2.25% |
3.19% |
70.67 |
|
| Council Estate Residents, Better-Off Homes |
1.74% |
11.31% |
15.39 |
|
| Council Estate Residents, High Unemployment |
0.00% |
3.06% |
0.00 |
|
| Council Estate Residents, Greatest Hardship |
0.00% |
2.52% |
0.00 |
|
| People in Multi-Ethnic, Low-Income Areas |
0.00% |
2.10% |
0.00 |
|
| Unclassified |
0.06% |
0.06% |
89.07 |
|
|
 |
|
|
| £0-5K |
11.92% |
9.41% |
126.63 |
|
| £5-10K |
20.49% |
16.63% |
123.20 |
|
| £10-15K |
19.37% |
16.58% |
116.86 |
|
| £15-20K |
14.73% |
13.58% |
108.45 |
|
| £20-25K |
10.32% |
10.39% |
99.32 |
|
| £25-30K |
7.02% |
7.77% |
90.35 |
|
| £30-35K |
4.75% |
5.79% |
82.01 |
|
| £35-40K |
3.23% |
4.33% |
74.53 |
|
| £40-45K |
2.22% |
3.27% |
67.94 |
|
| £45-50K |
1.54% |
2.48% |
62.19 |
|
| £50-55K |
1.09% |
1.90% |
57.20 |
|
| £55-60K |
0.78% |
1.47% |
52.86 |
|
| £60-65K |
0.57% |
1.15% |
49.08 |
|
| £65-70K |
0.41% |
0.91% |
45.78 |
|
| £70-75K |
0.31% |
0.72% |
42.88 |
|
| £75-80K |
0.23% |
0.57% |
40.32 |
|
| £80-85K |
0.18% |
0.46% |
38.05 |
|
| £85-90K |
0.13% |
0.37% |
36.03 |
|
| £90-95K |
0.10% |
0.31% |
34.22 |
|
| £95-100K |
0.08% |
0.25% |
32.59 |
|
| £100K + |
0.34% |
1.34% |
25.64 |
|
|
|
|


|
1992-1997
|
1997-2001
|
|
|
|
| Con |
-11.72% |
| Lab |
1.86% |
| LD |
6.88% |
|
| Con |
5.31% |
| Lab |
-11.73% |
| LD |
8.37% |
|
|
|
Norman Lamb
Liberal Democrat gain
|
| Con |
 |
23,495 |
41.79% |
| Lab |
 |
7,490 |
13.32% |
| LD |
 |
23,978 |
42.65% |
| Oth |
 |
1,257 |
2.24% |
| Maj |
 |
483 |
0.86% |
| Turn |
|
56,220 |
70.22% |
|
|
|
Norman Lamb
Liberal Democrat gain
|
| L |
Michael Gates |
7,490 |
13.32% |
| LD |
Norman Lamb |
23,978 |
42.65% |
| C |
David Prior |
23,495 |
41.79% |
| G |
Mike Sheridan |
649 |
1.15% |
| UK |
Paul Simison |
608 |
1.08% |
|
Candidates representing 5 parties stood for election to this seat.
|
|
|
David Prior
Conservative
|
| Con |
|
21,456 |
36.48% |
| Lab |
|
14,736 |
25.06% |
| LD |
|
20,163 |
34.28% |
| Ref |
 |
2,458 |
4.18% |
| Oth |
|
0 |
0.00% |
| Maj |
|
1,293 |
2.20% |
| Turn |
|
58,813 |
76.27% |
|
|
|
|
Conservative
|
| Con |
|
28,810 |
48.20% |
| Lab |
|
13,850 |
23.20% |
| LD |
|
16,365 |
27.40% |
| Oth |
|
726 |
1.20% |
| Maj |
|
12,445 |
20.80% |
| Turn |
|
59,751 |
81.04% |
|
|
|
|
|