|
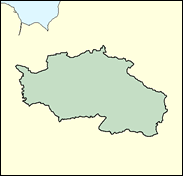
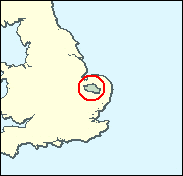
Norfolk South West
Conservative hold

Gillian Shephard, one of a large number of former Cabinet MInisters still sitting for East Anglian seats (Major, MacGregor, Gummer, Mawhinney) had the closest squeak of any when she only held South West Norfolk by 2,464 from Labour in 1997. The swing was no greater than average. This seat has long shown that it can produce close results. On all eight occasions it was contested between 1945 and 1966 it was won by less than 1,500 votes, on seven of these by under a thousand, a unique record of hair's breadth majorities. In three of these battles the Conservatives won, but in five Labour did. Since 1970 it has always been held by the Conservatives, but there was clearly Labour support in Breckland, in Thetford with its overspill estates in particular, but also in smaller towns like Swaffham and Downham Market. The prospect of another very close Conservative-Labour contest in Norfolk was enhanced by the apparently unilateral advice of the Liberal Democrat candidate on June 1 advising his supporters to vote Labour. How suggestible they are remains to be seen in this sturdy and independently-minded county.

Gillian Shephard, who rose as part of Major's East Anglian mafia to be the senior woman in the Conservative government, lingered on the frontbench in opposition for two years but, with age and Europhilia telling against her, left for the backbenches in 1999. As an ex-teacher, married to a comprehensive school headmaster, she was less rightwing than she sounded on vouchers and selectivity as Education Secretary. Tiny, direct and classless, born 1940, and educated at North Walsham Girls' School and St. Hilda's College Oxford, she comes from a background of livestock dealing, and as Minister of Agriculture luckily moved on before the BSE crisis struck. As Education Secretary she could often sound like a shrill school mistress. Labour's Anne Hanson, born 1953 and currently a student, has been a local councillor and member of Labour's NEC|Women's Committee. Educated at Pope John Comprehensive, Corby and Norwch City College, she has worked variously as a hairdresser, play group assistant, and adult education assistant tutor.
 |
| Wealthy Achievers, Suburban Areas |
11.06% |
14.99% |
73.80 |
|
| Affluent Greys, Rural Communities |
9.36% |
2.13% |
440.06 |
|
| Prosperous Pensioners, Retirement Areas |
12.27% |
2.49% |
493.59 |
|
| Affluent Executives, Family Areas |
3.01% |
4.43% |
67.94 |
|
| Well-Off Workers, Family Areas |
5.28% |
7.27% |
72.61 |
|
| Affluent Urbanites, Town & City Areas |
0.00% |
2.56% |
0.00 |
|
| Prosperous Professionals, Metropolitan Areas |
0.00% |
2.04% |
0.00 |
|
| Better-Off Executives, Inner City Areas |
0.00% |
3.94% |
0.00 |
|
| Comfortable Middle Agers, Mature Home Owning Areas |
31.56% |
13.04% |
242.03 |
|
| Skilled Workers, Home Owning Areas |
7.98% |
12.70% |
62.80 |
|
| New Home Owners, Mature Communities |
8.17% |
8.14% |
100.38 |
|
| White Collar Workers, Better-Off Multi Ethnic Areas |
0.48% |
4.02% |
11.99 |
|
| Older People, Less Prosperous Areas |
3.55% |
3.19% |
111.32 |
|
| Council Estate Residents, Better-Off Homes |
5.68% |
11.31% |
50.24 |
|
| Council Estate Residents, High Unemployment |
0.03% |
3.06% |
0.83 |
|
| Council Estate Residents, Greatest Hardship |
1.29% |
2.52% |
51.22 |
|
| People in Multi-Ethnic, Low-Income Areas |
0.00% |
2.10% |
0.00 |
|
| Unclassified |
0.28% |
0.06% |
455.33 |
|
|
 |
 |
 |
| £0-5K |
10.00% |
9.41% |
106.24 |
|
| £5-10K |
18.85% |
16.63% |
113.36 |
|
| £10-15K |
18.91% |
16.58% |
114.03 |
|
| £15-20K |
15.03% |
13.58% |
110.63 |
|
| £20-25K |
10.90% |
10.39% |
104.91 |
|
| £25-30K |
7.63% |
7.77% |
98.19 |
|
| £30-35K |
5.29% |
5.79% |
91.26 |
|
| £35-40K |
3.66% |
4.33% |
84.58 |
|
| £40-45K |
2.56% |
3.27% |
78.35 |
|
| £45-50K |
1.80% |
2.48% |
72.66 |
|
| £50-55K |
1.29% |
1.90% |
67.52 |
|
| £55-60K |
0.93% |
1.47% |
62.90 |
|
| £60-65K |
0.68% |
1.15% |
58.76 |
|
| £65-70K |
0.50% |
0.91% |
55.05 |
|
| £70-75K |
0.37% |
0.72% |
51.71 |
|
| £75-80K |
0.28% |
0.57% |
48.72 |
|
| £80-85K |
0.21% |
0.46% |
46.01 |
|
| £85-90K |
0.16% |
0.37% |
43.57 |
|
| £90-95K |
0.13% |
0.31% |
41.35 |
|
| £95-100K |
0.10% |
0.25% |
39.33 |
|
| £100K + |
0.41% |
1.34% |
30.33 |
|
|
|

|


|
1992-1997
|
1997-2001
|
|
|
|
| Con |
-12.70% |
| Lab |
10.81% |
| LD |
-4.29% |
|
| Con |
10.19% |
| Lab |
-3.31% |
| LD |
-3.18% |
|
|
 |
Gillian Shephard
Conservative hold
|
| Con |
 |
27,633 |
52.19% |
| Lab |
 |
18,267 |
34.50% |
| LD |
 |
5,681 |
10.73% |
| Oth |
 |
1,368 |
2.58% |
| Maj |
 |
9,366 |
17.69% |
| Turn |
 |
52,949 |
63.11% |
|
|
 |
Gillian Shephard
Conservative hold
|
| LD |
Gordon Dean |
5,681 |
10.73% |
| L |
Anne Hanson |
18,267 |
34.50% |
| C |
Gillian Shephard |
27,633 |
52.19% |
| UK |
Ian Smith |
1,368 |
2.58% |
|
Candidates representing 4 parties stood for election to this seat.
|
|
 |
Gillian Shepard
Conservative
|
| Con |
 |
24,694 |
42.00% |
| Lab |
 |
22,230 |
37.81% |
| LD |
 |
8,178 |
13.91% |
| Ref |
 |
3,694 |
6.28% |
| Oth |
|
0 |
0.00% |
| Maj |
 |
2,464 |
4.19% |
| Turn |
 |
58,796 |
73.28% |
|
|
 |
|
Conservative
|
| Con |
 |
34,098 |
54.70% |
| Lab |
 |
16,848 |
27.00% |
| LD |
 |
11,343 |
18.20% |
| Oth |
|
0 |
0.00% |
| Maj |
 |
17,250 |
27.70% |
| Turn |
 |
62,289 |
79.14% |
|
|
 |
|

|

