|
Normanton
Labour hold

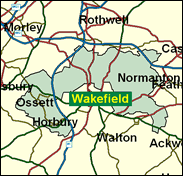
Normanton is not one of the better-known constituency names. It is doubtful that many people who live far from this part of West Yorkshire could identify where it might be. It is not on any major routes, so people tend not to pass by on the way to another destination. The population base is stable, with considerably fewer people than average changing their address within a tear of the Census being taken ("migrants"). Normanton may be relatively obscure, but it has every bit as much right to return a Member of Parliament as Hampstead and Highgate or the Cities of London and Westminster. The seat is wrappewd around the city of Wakefield like a kidney, from Normanton and Sharlston in the east, to Stanley north of Wakefield, Ossett to the west and finally Horbury to the south west. Essentially the Normantion constituency is safe for Labour without being overwhelmingly so. In 1992 the majority would have been around 7,000 on current boundaries. In the May 2000 local elections the Conservatives won Horbury and the Liberal Democrats Ossett.

Born 1929, Catholic-educated and (extramurally) at Leeds University, Bill O'Brien was a coal face worker for nearly 40 years before exchanging the pithead baths for a Commons seat. An anti-Scargill moderate, he served as a (Catholic) Northern Ireland spokesman in Opposition, and is in the tiny Labour minority which votes against homosexual sex at 16.
 |
| Wealthy Achievers, Suburban Areas |
5.94% |
14.99% |
39.62 |
|
| Affluent Greys, Rural Communities |
0.00% |
2.13% |
0.00 |
|
| Prosperous Pensioners, Retirement Areas |
0.03% |
2.49% |
1.31 |
|
| Affluent Executives, Family Areas |
3.71% |
4.43% |
83.93 |
|
| Well-Off Workers, Family Areas |
23.42% |
7.27% |
321.98 |
|
| Affluent Urbanites, Town & City Areas |
0.22% |
2.56% |
8.66 |
|
| Prosperous Professionals, Metropolitan Areas |
0.00% |
2.04% |
0.00 |
|
| Better-Off Executives, Inner City Areas |
0.16% |
3.94% |
4.16 |
|
| Comfortable Middle Agers, Mature Home Owning Areas |
15.32% |
13.04% |
117.53 |
|
| Skilled Workers, Home Owning Areas |
22.91% |
12.70% |
180.34 |
|
| New Home Owners, Mature Communities |
13.22% |
8.14% |
162.38 |
|
| White Collar Workers, Better-Off Multi Ethnic Areas |
0.82% |
4.02% |
20.29 |
|
| Older People, Less Prosperous Areas |
5.27% |
3.19% |
165.32 |
|
| Council Estate Residents, Better-Off Homes |
7.31% |
11.31% |
64.65 |
|
| Council Estate Residents, High Unemployment |
0.68% |
3.06% |
22.19 |
|
| Council Estate Residents, Greatest Hardship |
0.98% |
2.52% |
38.82 |
|
| People in Multi-Ethnic, Low-Income Areas |
0.00% |
2.10% |
0.00 |
|
| Unclassified |
0.00% |
0.06% |
0.00 |
|
|
 |
 |
 |
| £0-5K |
7.96% |
9.41% |
84.61 |
|
| £5-10K |
16.01% |
16.63% |
96.27 |
|
| £10-15K |
17.20% |
16.58% |
103.74 |
|
| £15-20K |
14.63% |
13.58% |
107.68 |
|
| £20-25K |
11.32% |
10.39% |
108.96 |
|
| £25-30K |
8.43% |
7.77% |
108.41 |
|
| £30-35K |
6.18% |
5.79% |
106.68 |
|
| £35-40K |
4.52% |
4.33% |
104.23 |
|
| £40-45K |
3.31% |
3.27% |
101.37 |
|
| £45-50K |
2.44% |
2.48% |
98.32 |
|
| £50-55K |
1.81% |
1.90% |
95.21 |
|
| £55-60K |
1.36% |
1.47% |
92.14 |
|
| £60-65K |
1.03% |
1.15% |
89.15 |
|
| £65-70K |
0.78% |
0.91% |
86.28 |
|
| £70-75K |
0.60% |
0.72% |
83.54 |
|
| £75-80K |
0.47% |
0.57% |
80.93 |
|
| £80-85K |
0.36% |
0.46% |
78.47 |
|
| £85-90K |
0.29% |
0.37% |
76.14 |
|
| £90-95K |
0.23% |
0.31% |
73.94 |
|
| £95-100K |
0.18% |
0.25% |
71.87 |
|
| £100K + |
0.82% |
1.34% |
61.19 |
|
|
|

|


|
1992-1997
|
1997-2001
|
|
|
|
| Con |
-11.99% |
| Lab |
9.47% |
| LD |
-0.87% |
|
| Con |
3.37% |
| Lab |
-4.49% |
| LD |
2.18% |
|
|
 |
William O'Brien
Labour hold
|
| Con |
 |
9,215 |
26.98% |
| Lab |
 |
19,152 |
56.07% |
| LD |
 |
4,990 |
14.61% |
| Oth |
 |
798 |
2.34% |
| Maj |
 |
9,937 |
29.09% |
| Turn |
 |
34,155 |
52.23% |
|
|
 |
William O'Brien
Labour hold
|
| SL |
Mick Appleyard |
798 |
2.34% |
| L |
William O'Brien |
19,152 |
56.07% |
| LD |
Stephen Pearson |
4,990 |
14.61% |
| C |
Graham Smith |
9,215 |
26.98% |
|
Candidates representing 4 parties stood for election to this seat.
|
|
 |
Bill O'Brien
Labour
|
| Con |
 |
10,153 |
23.61% |
| Lab |
 |
26,046 |
60.57% |
| LD |
 |
5,347 |
12.43% |
| Ref |
 |
1,458 |
3.39% |
| Oth |
|
0 |
0.00% |
| Maj |
 |
15,893 |
36.96% |
| Turn |
 |
43,004 |
68.28% |
|
|
 |
|
Labour
|
| Con |
 |
16,467 |
35.60% |
| Lab |
 |
23,659 |
51.10% |
| LD |
 |
6,155 |
13.30% |
| Oth |
|
0 |
0.00% |
| Maj |
 |
7,192 |
15.50% |
| Turn |
 |
46,281 |
74.80% |
|
|
 |
|

|

