|
Northampton North
Labour hold

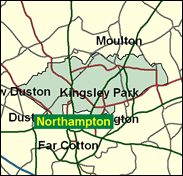
The safer of the two Northampton seats by far for Labour. Sally Keeble ejected the Right-winger Tony Marlow by exactly 10,000 in 1997. The best bets would give her a majority again, but this time in four figures rather than five. This seat includes a mixture of Northampton neighbourhoods from the above average value residental areas of Park and Headlands wards to the old Labour council estate of Dallington / Kings Heath, and also the modern New Town developments like Lumbertubs, Thorplands and Links which are more volatile, but would have voted Labour in 1997, and the 20pc gap over the Conservatives across the constituency as a whole had not been closed at all by the May 1999 unitary authority elections.

Sally Keeble, a public-school (Cheltenham Ladies)-and-Oxford (St Hugh's)-educated, pageboy-bobbed, mandarin's daughter (her father was British ambassador in Moscow), was elected here in 1997 and later appointed PPS to Hilary Armstrong. Born 1951, and flat, classlessly-voiced, after establishing a reputation as an effective leader of Southwark Council in the early nineties, she was picked from an all-women shortlist, and told Joe Ashton off for being found in a Thai sauna in her constituency. In less on-message mode, she backs an elected House of Lords.
 |
| Wealthy Achievers, Suburban Areas |
3.01% |
14.99% |
20.08 |
|
| Affluent Greys, Rural Communities |
0.00% |
2.13% |
0.00 |
|
| Prosperous Pensioners, Retirement Areas |
0.64% |
2.49% |
25.79 |
|
| Affluent Executives, Family Areas |
5.60% |
4.43% |
126.61 |
|
| Well-Off Workers, Family Areas |
12.62% |
7.27% |
173.51 |
|
| Affluent Urbanites, Town & City Areas |
0.63% |
2.56% |
24.66 |
|
| Prosperous Professionals, Metropolitan Areas |
0.00% |
2.04% |
0.00 |
|
| Better-Off Executives, Inner City Areas |
0.83% |
3.94% |
21.15 |
|
| Comfortable Middle Agers, Mature Home Owning Areas |
15.45% |
13.04% |
118.50 |
|
| Skilled Workers, Home Owning Areas |
10.41% |
12.70% |
81.96 |
|
| New Home Owners, Mature Communities |
9.73% |
8.14% |
119.50 |
|
| White Collar Workers, Better-Off Multi Ethnic Areas |
6.90% |
4.02% |
171.59 |
|
| Older People, Less Prosperous Areas |
5.13% |
3.19% |
161.03 |
|
| Council Estate Residents, Better-Off Homes |
23.39% |
11.31% |
206.76 |
|
| Council Estate Residents, High Unemployment |
0.59% |
3.06% |
19.40 |
|
| Council Estate Residents, Greatest Hardship |
5.05% |
2.52% |
200.67 |
|
| People in Multi-Ethnic, Low-Income Areas |
0.00% |
2.10% |
0.00 |
|
| Unclassified |
0.00% |
0.06% |
0.00 |
|
|
 |
 |
 |
| £0-5K |
10.76% |
9.41% |
114.25 |
|
| £5-10K |
18.21% |
16.63% |
109.50 |
|
| £10-15K |
17.77% |
16.58% |
107.18 |
|
| £15-20K |
14.22% |
13.58% |
104.67 |
|
| £20-25K |
10.56% |
10.39% |
101.61 |
|
| £25-30K |
7.63% |
7.77% |
98.10 |
|
| £30-35K |
5.46% |
5.79% |
94.35 |
|
| £35-40K |
3.92% |
4.33% |
90.51 |
|
| £40-45K |
2.83% |
3.27% |
86.72 |
|
| £45-50K |
2.06% |
2.48% |
83.05 |
|
| £50-55K |
1.51% |
1.90% |
79.55 |
|
| £55-60K |
1.12% |
1.47% |
76.25 |
|
| £60-65K |
0.84% |
1.15% |
73.15 |
|
| £65-70K |
0.64% |
0.91% |
70.25 |
|
| £70-75K |
0.49% |
0.72% |
67.56 |
|
| £75-80K |
0.37% |
0.57% |
65.05 |
|
| £80-85K |
0.29% |
0.46% |
62.71 |
|
| £85-90K |
0.23% |
0.37% |
60.54 |
|
| £90-95K |
0.18% |
0.31% |
58.52 |
|
| £95-100K |
0.14% |
0.25% |
56.64 |
|
| £100K + |
0.64% |
1.34% |
47.47 |
|
|
|

|


|
1992-1997
|
1997-2001
|
|
|
|
| Con |
-12.44% |
| Lab |
14.10% |
| LD |
-2.47% |
|
| Con |
-2.96% |
| Lab |
-3.28% |
| LD |
5.02% |
|
|
 |
Sally Keeble
Labour hold
|
| Con |
 |
12,614 |
30.40% |
| Lab |
 |
20,507 |
49.42% |
| LD |
 |
7,363 |
17.74% |
| Oth |
 |
1,010 |
2.43% |
| Maj |
 |
7,893 |
19.02% |
| Turn |
 |
41,494 |
55.98% |
|
|
 |
Sally Keeble
Labour hold
|
| LD |
Richard Church |
7,363 |
17.74% |
| L |
Sally Keeble |
20,507 |
49.42% |
| UK |
Dusan Torbica |
596 |
1.44% |
| C |
John Whelan |
12,614 |
30.40% |
| SA |
Gordon White |
414 |
1.00% |
|
Candidates representing 5 parties stood for election to this seat.
|
|
 |
Sally Keeble
Labour gain
|
| Con |
 |
17,247 |
33.36% |
| Lab |
 |
27,247 |
52.70% |
| LD |
 |
6,579 |
12.73% |
| Ref |
|
0 |
0.00% |
| Oth |
 |
625 |
1.21% |
| Maj |
 |
10,000 |
19.34% |
| Turn |
 |
51,698 |
70.18% |
|
|
 |
|
Conservative
|
| Con |
 |
25,972 |
45.80% |
| Lab |
 |
21,905 |
38.60% |
| LD |
 |
8,630 |
15.20% |
| Oth |
 |
232 |
0.40% |
| Maj |
 |
4,067 |
7.20% |
| Turn |
 |
56,739 |
77.31% |
|
|
 |
|

|

