|
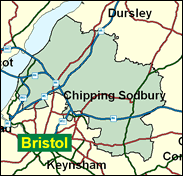
Northavon
Liberal Democrat hold

Although Northavon was not one of the more widely predicted Liberal Democrat gains of 1997, Steve Webb has proved one of the more prominent of his party's 26 new MPs, and clearly has both prospects and ambitions to enter the upper ranks of his party at Westminster. To do so, he must maintain and strengthen his grip on his seat, but this is a task often achieved by Liberal parliamentarians in recent decades. If he can win Northavon at least once more, his position will be further improved by the Boundary Commission, which is creating an extra seat in the area in its next national review, which may be published before the election after next. Webb seems to have his eye on the proposed Yate and Thornbury seat. Will he retain Northavon long enough to enter Yate/Thornbury's first contest as an incumbent? The continued weakness of the Conservatives, the possibility of squeezing Labour's 9,767 voters from 1997, and his own ability and energy all suggest Webb has a good chance.

Steve Webb, surprisingly elected in 1997, and initially keen to be addressed by his recently acquired Bath University professorial rank, is a social policy expert, notably on pensions. Rather exaggeratedly billed (by the Evening Standard) as making David Willetts "look like a thicko", he was born 1965, attended Dartmouth High School, Birmingham and Hertford College Oxford. It was his Liberal-Democrat-tabled amendment on lone parent benefit cuts that sparked Labour's first big backbench revolt in 1997. This unexpected Liberal Democrat MP faces a glamorous Conservative challenger in unmarried mother Dr Carrie Ruxton, Scots-born (and accented) in 1967 and educated at Morrison's Academy, Crieff and Queen Margaret College, Edinburgh (where she acquired a doctorate in 'nutrition'), she is a state-registered dietician, currently with the Sugar Bureau, having earlier lectured in Nutrition. An adviser to fellow Scot, Tory Health spokesman Liam Fox, her son Christopher was born in 2000. Unresistant to being listed as a Europhile, she is willing to be convinced on the single currency, and believes women are not discriminated against in Tory selections. She speaks from experience, having only joined the Party in 1997.
 |
| Wealthy Achievers, Suburban Areas |
28.98% |
14.99% |
193.27 |
|
| Affluent Greys, Rural Communities |
0.64% |
2.13% |
29.98 |
|
| Prosperous Pensioners, Retirement Areas |
0.91% |
2.49% |
36.50 |
|
| Affluent Executives, Family Areas |
19.20% |
4.43% |
433.92 |
|
| Well-Off Workers, Family Areas |
15.68% |
7.27% |
215.58 |
|
| Affluent Urbanites, Town & City Areas |
1.70% |
2.56% |
66.16 |
|
| Prosperous Professionals, Metropolitan Areas |
0.00% |
2.04% |
0.00 |
|
| Better-Off Executives, Inner City Areas |
0.01% |
3.94% |
0.31 |
|
| Comfortable Middle Agers, Mature Home Owning Areas |
13.39% |
13.04% |
102.66 |
|
| Skilled Workers, Home Owning Areas |
11.53% |
12.70% |
90.79 |
|
| New Home Owners, Mature Communities |
4.27% |
8.14% |
52.46 |
|
| White Collar Workers, Better-Off Multi Ethnic Areas |
0.00% |
4.02% |
0.00 |
|
| Older People, Less Prosperous Areas |
1.45% |
3.19% |
45.67 |
|
| Council Estate Residents, Better-Off Homes |
2.18% |
11.31% |
19.26 |
|
| Council Estate Residents, High Unemployment |
0.03% |
3.06% |
1.09 |
|
| Council Estate Residents, Greatest Hardship |
0.00% |
2.52% |
0.07 |
|
| People in Multi-Ethnic, Low-Income Areas |
0.00% |
2.10% |
0.00 |
|
| Unclassified |
0.03% |
0.06% |
43.30 |
|
|
 |
 |
 |
| £0-5K |
4.57% |
9.41% |
48.50 |
|
| £5-10K |
11.42% |
16.63% |
68.67 |
|
| £10-15K |
14.56% |
16.58% |
87.85 |
|
| £15-20K |
14.05% |
13.58% |
103.44 |
|
| £20-25K |
11.96% |
10.39% |
115.03 |
|
| £25-30K |
9.58% |
7.77% |
123.28 |
|
| £30-35K |
7.47% |
5.79% |
128.99 |
|
| £35-40K |
5.76% |
4.33% |
132.84 |
|
| £40-45K |
4.42% |
3.27% |
135.32 |
|
| £45-50K |
3.40% |
2.48% |
136.81 |
|
| £50-55K |
2.62% |
1.90% |
137.55 |
|
| £55-60K |
2.03% |
1.47% |
137.73 |
|
| £60-65K |
1.58% |
1.15% |
137.51 |
|
| £65-70K |
1.24% |
0.91% |
136.98 |
|
| £70-75K |
0.98% |
0.72% |
136.23 |
|
| £75-80K |
0.78% |
0.57% |
135.31 |
|
| £80-85K |
0.62% |
0.46% |
134.26 |
|
| £85-90K |
0.50% |
0.37% |
133.14 |
|
| £90-95K |
0.40% |
0.31% |
131.95 |
|
| £95-100K |
0.33% |
0.25% |
130.73 |
|
| £100K + |
1.64% |
1.34% |
122.32 |
|
|
|

|


|
1992-1997
|
1997-2001
|
|
|
|
| Con |
-12.84% |
| Lab |
3.52% |
| LD |
7.88% |
|
| Con |
-3.80% |
| Lab |
-3.89% |
| LD |
10.74% |
|
|
 |
Steven Webb
Liberal Democrat hold
|
| Con |
 |
19,340 |
35.16% |
| Lab |
 |
6,450 |
11.73% |
| LD |
 |
29,217 |
53.12% |
| Oth |
|
0 |
0.00% |
| Maj |
 |
9,877 |
17.96% |
| Turn |
 |
55,007 |
69.77% |
|
|
 |
Steven Webb
Liberal Democrat hold
|
| C |
Robert Hall |
19,340 |
35.16% |
| L |
Carrie Ruxton |
6,450 |
11.73% |
| LD |
Steven Webb |
29,217 |
53.12% |
|
Candidates representing 3 parties stood for election to this seat.
|
|
 |
Steven Webb
Liberal Democrat gain
|
| Con |
 |
24,363 |
38.96% |
| Lab |
 |
9,767 |
15.62% |
| LD |
 |
26,500 |
42.38% |
| Ref |
 |
1,900 |
3.04% |
| Oth |
|
0 |
0.00% |
| Maj |
 |
2,137 |
3.42% |
| Turn |
 |
62,530 |
79.21% |
|
|
 |
|
Conservative
|
| Con |
 |
32,700 |
51.80% |
| Lab |
 |
7,625 |
12.10% |
| LD |
 |
21,759 |
34.50% |
| Oth |
 |
1,049 |
1.70% |
| Maj |
 |
10,941 |
17.30% |
| Turn |
 |
63,133 |
84.75% |
|
|
 |
|

|

