|
Norwich North
Labour hold

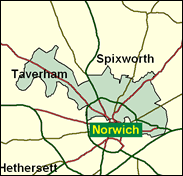
Norwich has a long tradition of radicalism, and Labour are strong favourites to hold both Norwich seats in 2001. The city council is, as it has been for decades, a hopeless no-go area for the Conservatives, although the Liberal Democrats have extended their urban assault on Labour very successfully to Norwich, winning no fewer than 10 of the 16 wards in May 2000, including six gains. This is highly unlikely to make an impact on the parliamentary outcome, however, and the lively Ian Gibson seems set for a second term, even though half of this seat lies outside the city boundaries in the District of Broadland, and it is not as strongly Labour as South, which is entirely within the city.

Dr Ian Gibson, one of a score of Scots representing Labour in English seats, won here in 1997. With fading good looks and an ironical air, a recycled ex-Trot from the Socialist Workers' Party, he was born in 1938, educated at Dumfries Academy and at Edinburgh, Indiana and Washington Universities, and was a biologist at East Anglia University for 26 years. Entering the Commons at 58, a specialist in biotechnological research, and a spokesman on most things scientific, he takes a pragmatic line on various of the new orthodoxies, such as hostility to genetically modified organisms, and support for all-women shortlists, and has only rebelled selectively - on lone parent, and disability, benefit cuts.
 |
| Wealthy Achievers, Suburban Areas |
11.37% |
14.99% |
75.81 |
|
| Affluent Greys, Rural Communities |
0.00% |
2.13% |
0.00 |
|
| Prosperous Pensioners, Retirement Areas |
3.37% |
2.49% |
135.64 |
|
| Affluent Executives, Family Areas |
9.40% |
4.43% |
212.51 |
|
| Well-Off Workers, Family Areas |
6.37% |
7.27% |
87.55 |
|
| Affluent Urbanites, Town & City Areas |
1.27% |
2.56% |
49.54 |
|
| Prosperous Professionals, Metropolitan Areas |
0.36% |
2.04% |
17.51 |
|
| Better-Off Executives, Inner City Areas |
0.04% |
3.94% |
1.06 |
|
| Comfortable Middle Agers, Mature Home Owning Areas |
25.03% |
13.04% |
192.00 |
|
| Skilled Workers, Home Owning Areas |
9.47% |
12.70% |
74.52 |
|
| New Home Owners, Mature Communities |
10.54% |
8.14% |
129.46 |
|
| White Collar Workers, Better-Off Multi Ethnic Areas |
3.19% |
4.02% |
79.27 |
|
| Older People, Less Prosperous Areas |
4.38% |
3.19% |
137.65 |
|
| Council Estate Residents, Better-Off Homes |
9.99% |
11.31% |
88.30 |
|
| Council Estate Residents, High Unemployment |
1.57% |
3.06% |
51.34 |
|
| Council Estate Residents, Greatest Hardship |
3.20% |
2.52% |
127.06 |
|
| People in Multi-Ethnic, Low-Income Areas |
0.00% |
2.10% |
0.00 |
|
| Unclassified |
0.44% |
0.06% |
712.31 |
|
|
 |
 |
 |
| £0-5K |
11.39% |
9.41% |
121.01 |
|
| £5-10K |
20.58% |
16.63% |
123.71 |
|
| £10-15K |
19.31% |
16.58% |
116.48 |
|
| £15-20K |
14.57% |
13.58% |
107.27 |
|
| £20-25K |
10.21% |
10.39% |
98.27 |
|
| £25-30K |
7.00% |
7.77% |
90.04 |
|
| £30-35K |
4.79% |
5.79% |
82.71 |
|
| £35-40K |
3.30% |
4.33% |
76.21 |
|
| £40-45K |
2.30% |
3.27% |
70.47 |
|
| £45-50K |
1.62% |
2.48% |
65.38 |
|
| £50-55K |
1.16% |
1.90% |
60.87 |
|
| £55-60K |
0.84% |
1.47% |
56.85 |
|
| £60-65K |
0.61% |
1.15% |
53.25 |
|
| £65-70K |
0.45% |
0.91% |
50.02 |
|
| £70-75K |
0.34% |
0.72% |
47.11 |
|
| £75-80K |
0.26% |
0.57% |
44.48 |
|
| £80-85K |
0.19% |
0.46% |
42.09 |
|
| £85-90K |
0.15% |
0.37% |
39.91 |
|
| £90-95K |
0.12% |
0.31% |
37.92 |
|
| £95-100K |
0.09% |
0.25% |
36.10 |
|
| £100K + |
0.37% |
1.34% |
27.70 |
|
|
|

|


|
1992-1997
|
1997-2001
|
|
|
|
| Con |
-11.73% |
| Lab |
9.37% |
| LD |
-1.97% |
|
| Con |
2.08% |
| Lab |
-2.26% |
| LD |
2.17% |
|
|
 |
Ian Gibson
Labour hold
|
| Con |
 |
15,761 |
34.55% |
| Lab |
 |
21,624 |
47.41% |
| LD |
 |
6,750 |
14.80% |
| Oth |
 |
1,479 |
3.24% |
| Maj |
 |
5,863 |
12.85% |
| Turn |
 |
45,614 |
60.89% |
|
|
 |
Ian Gibson
Labour hold
|
| I |
Michael Betts |
211 |
0.46% |
| UK |
Guy Cheyney |
471 |
1.03% |
| L |
Ian Gibson |
21,624 |
47.41% |
| C |
Kay Mason |
15,761 |
34.55% |
| G |
Robert Tinch |
797 |
1.75% |
| LD |
Moira Toye |
6,750 |
14.80% |
|
Candidates representing 6 parties stood for election to this seat.
|
|
 |
Ian Gibson
Labour gain
|
| Con |
 |
17,876 |
32.47% |
| Lab |
 |
27,346 |
49.67% |
| LD |
 |
6,951 |
12.63% |
| Ref |
 |
1,777 |
3.23% |
| Oth |
 |
1,107 |
2.01% |
| Maj |
 |
9,470 |
17.20% |
| Turn |
 |
55,057 |
75.92% |
|
|
 |
|
Conservative
|
| Con |
 |
25,558 |
44.20% |
| Lab |
 |
23,288 |
40.30% |
| LD |
 |
8,462 |
14.60% |
| Oth |
 |
543 |
0.90% |
| Maj |
 |
2,270 |
3.90% |
| Turn |
 |
57,851 |
80.59% |
|
|
 |
|

|

