|
Norwich South
Labour hold

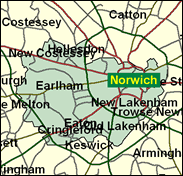
Norwich South is the better of the two seats in the city, the nation's second largest in medieval times, for Labour, but this has not always been so. It depends on the way the Boundary Commission draws the lines. Whichever seat has more Norwich wards and fewer from the suburbs in other local authorities is safer for Labour. Since 1983 this has been South, which includes the city centre with its plethora of churches, cathedral and close, but also more council tenants; it also happened to be more upper class socially, and contains the university, but it elected Charles Clarke who sits very close to the centre of New Labour in many ways by over 14,000 in 1997. More and more fringe and single-issue candidates are contesting general elections, with varying degrees of seriousness. One such in 1997 was Howard Marks, sent to an American jail on a 20 year sentence for marijuana smuggling and the author of the autobiography Mr Nice. He stood for three seats on a Legalise Cannabis party ticket, the others being Neath (he was originally from South Wales before graduating from Balliol College, Oxford) and Norwich North, but he did best in Norwich South, polling 765 votes. It is hard to say how much should be read into this; he is indeed widely known for his charm.

Charles Clarke, Labour MP here since 1997, is an apparatchik (as ex-head of Neil Kinnock's office), who was born in to the mandarinate (as the son of Sir Richard Clarke, head of the Ministry of Technology in the Wilson years). A resistantly-bearded Minister of State at the Home Office who is constantly tipped for Cabinet office, he was born 1950, educated at Highgate and King's, Cambridge, and worked with Kinnock for eleven years, nine of them whilst he was Labour leader. Author of a leaked letter attacking lone parent benefit cuts in 1997, which he nonetheless backed, he is now often called upon at Conference fringe meetings to define the "big ideas for the second term", without necessarily clarifying the picture.
 |
| Wealthy Achievers, Suburban Areas |
9.76% |
14.99% |
65.09 |
|
| Affluent Greys, Rural Communities |
0.00% |
2.13% |
0.00 |
|
| Prosperous Pensioners, Retirement Areas |
3.90% |
2.49% |
156.72 |
|
| Affluent Executives, Family Areas |
2.31% |
4.43% |
52.31 |
|
| Well-Off Workers, Family Areas |
0.98% |
7.27% |
13.49 |
|
| Affluent Urbanites, Town & City Areas |
5.79% |
2.56% |
225.91 |
|
| Prosperous Professionals, Metropolitan Areas |
2.88% |
2.04% |
140.86 |
|
| Better-Off Executives, Inner City Areas |
6.24% |
3.94% |
158.13 |
|
| Comfortable Middle Agers, Mature Home Owning Areas |
10.25% |
13.04% |
78.57 |
|
| Skilled Workers, Home Owning Areas |
3.93% |
12.70% |
30.92 |
|
| New Home Owners, Mature Communities |
9.94% |
8.14% |
122.06 |
|
| White Collar Workers, Better-Off Multi Ethnic Areas |
9.45% |
4.02% |
235.10 |
|
| Older People, Less Prosperous Areas |
8.56% |
3.19% |
268.67 |
|
| Council Estate Residents, Better-Off Homes |
11.54% |
11.31% |
102.01 |
|
| Council Estate Residents, High Unemployment |
8.52% |
3.06% |
278.18 |
|
| Council Estate Residents, Greatest Hardship |
5.94% |
2.52% |
235.85 |
|
| People in Multi-Ethnic, Low-Income Areas |
0.00% |
2.10% |
0.00 |
|
| Unclassified |
0.02% |
0.06% |
33.04 |
|
|
 |
 |
 |
| £0-5K |
14.36% |
9.41% |
152.59 |
|
| £5-10K |
22.09% |
16.63% |
132.79 |
|
| £10-15K |
18.94% |
16.58% |
114.25 |
|
| £15-20K |
13.55% |
13.58% |
99.76 |
|
| £20-25K |
9.23% |
10.39% |
88.80 |
|
| £25-30K |
6.25% |
7.77% |
80.41 |
|
| £30-35K |
4.28% |
5.79% |
73.86 |
|
| £35-40K |
2.97% |
4.33% |
68.63 |
|
| £40-45K |
2.10% |
3.27% |
64.34 |
|
| £45-50K |
1.51% |
2.48% |
60.77 |
|
| £50-55K |
1.10% |
1.90% |
57.74 |
|
| £55-60K |
0.81% |
1.47% |
55.13 |
|
| £60-65K |
0.61% |
1.15% |
52.84 |
|
| £65-70K |
0.46% |
0.91% |
50.82 |
|
| £70-75K |
0.35% |
0.72% |
49.02 |
|
| £75-80K |
0.27% |
0.57% |
47.39 |
|
| £80-85K |
0.21% |
0.46% |
45.90 |
|
| £85-90K |
0.17% |
0.37% |
44.55 |
|
| £90-95K |
0.13% |
0.31% |
43.29 |
|
| £95-100K |
0.11% |
0.25% |
42.13 |
|
| £100K + |
0.49% |
1.34% |
36.27 |
|
|
|

|


|
1992-1997
|
1997-2001
|
|
|
|
| Con |
-14.42% |
| Lab |
5.71% |
| LD |
4.52% |
|
| Con |
1.10% |
| Lab |
-6.23% |
| LD |
4.02% |
|
|
 |
Charles Clarke
Labour hold
|
| Con |
 |
10,551 |
24.77% |
| Lab |
 |
19,367 |
45.47% |
| LD |
 |
9,640 |
22.63% |
| Oth |
 |
3,034 |
7.12% |
| Maj |
 |
8,816 |
20.70% |
| Turn |
 |
42,592 |
64.74% |
|
|
 |
Charles Clarke
Labour hold
|
| LD |
Andrew Aalders-Dunthorne |
9,640 |
22.63% |
| LCA |
Alun Buffrey |
620 |
1.46% |
| L |
Charles Clarke |
19,367 |
45.47% |
| C |
Andrew French |
10,551 |
24.77% |
| G |
Adrian Holmes |
1,434 |
3.37% |
| SA |
Edward Manningham |
507 |
1.19% |
| UK |
Tarquin Mills |
473 |
1.11% |
|
Candidates representing 7 parties stood for election to this seat.
|
|
 |
Charles Clarke
Labour
|
| Con |
 |
12,028 |
23.68% |
| Lab |
 |
26,267 |
51.71% |
| LD |
 |
9,457 |
18.62% |
| Ref |
 |
1,464 |
2.88% |
| Oth |
 |
1,585 |
3.12% |
| Maj |
 |
14,239 |
28.03% |
| Turn |
 |
50,801 |
72.56% |
|
|
 |
|
Labour
|
| Con |
 |
21,196 |
38.10% |
| Lab |
 |
25,546 |
46.00% |
| LD |
 |
7,820 |
14.10% |
| Oth |
 |
1,006 |
1.80% |
| Maj |
 |
4,350 |
7.80% |
| Turn |
 |
55,568 |
79.80% |
|
|
 |
|

|

