|
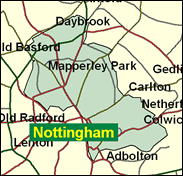
Nottingham East
Labour hold

In the 1980s the Conservative held Nottingham East, but in 1992 John Heppell gained the seat for Labour with one of the biggest swings in the country and a margin of 7,680, even at a time when Labour, led by Neil Kinnock, were losing nationally. Then in 1992 Heppell benefited from a national average swing around doubled the lead again, so that East no longer figures in the list of marginal seats which have a good chance of changing hands. It looks like 1992 was the out-of-kilter year, but in fact there is a strong case to be made for saying that it was 1987 which was peculiar. In the East Midlands as a whole in that year the Labour party was still reeling from the effects of the miners' strike - or in many parts of Nottinghamshire, non-strike - of 1984-5, which divided the party, as it did communities and even families. In Nottingham East in particular 1987 had seen a last-minute ruction in the local party as Black Section activist Sharon Atkin was replaced by local county councillor Mohammed Aslam. Aslam still only lost by 456 votes, but the party's disunited state clearly damaged their performance. Things are back to normal now.

Bearded John Heppell, PPS to John Prescott, does not, despite his background as a fitter and workshop supervisor with British Railways, appear to have made much headway with his boss on an "integrated transport policy." Elected here in 1992, he was born a Geordie in 1948, and educated at Rutherford Grammar School and Ashington Technical College, and was initially a miner. Selected for the seat after a prolonged spat, involving rival Asian contenders, he backed Beckett for leader, not Blair, in 1994, but became something of an on-message performer after 1997, notwithstanding his backing for republicanism. On behalf of his Asian constituents he backs calls for a Kashmir plebiscite, but no longer do his knuckles bear the inscriptions 'love' and 'hate.'
 |
| Wealthy Achievers, Suburban Areas |
5.69% |
14.99% |
37.98 |
|
| Affluent Greys, Rural Communities |
0.00% |
2.13% |
0.00 |
|
| Prosperous Pensioners, Retirement Areas |
0.81% |
2.49% |
32.43 |
|
| Affluent Executives, Family Areas |
0.21% |
4.43% |
4.82 |
|
| Well-Off Workers, Family Areas |
1.26% |
7.27% |
17.32 |
|
| Affluent Urbanites, Town & City Areas |
6.12% |
2.56% |
238.81 |
|
| Prosperous Professionals, Metropolitan Areas |
1.98% |
2.04% |
96.99 |
|
| Better-Off Executives, Inner City Areas |
8.78% |
3.94% |
222.75 |
|
| Comfortable Middle Agers, Mature Home Owning Areas |
6.18% |
13.04% |
47.42 |
|
| Skilled Workers, Home Owning Areas |
9.35% |
12.70% |
73.61 |
|
| New Home Owners, Mature Communities |
6.75% |
8.14% |
82.91 |
|
| White Collar Workers, Better-Off Multi Ethnic Areas |
7.58% |
4.02% |
188.36 |
|
| Older People, Less Prosperous Areas |
1.76% |
3.19% |
55.39 |
|
| Council Estate Residents, Better-Off Homes |
24.82% |
11.31% |
219.42 |
|
| Council Estate Residents, High Unemployment |
7.57% |
3.06% |
247.35 |
|
| Council Estate Residents, Greatest Hardship |
5.13% |
2.52% |
203.79 |
|
| People in Multi-Ethnic, Low-Income Areas |
5.84% |
2.10% |
278.27 |
|
| Unclassified |
0.15% |
0.06% |
233.58 |
|
|
 |
 |
 |
| £0-5K |
16.45% |
9.41% |
174.77 |
|
| £5-10K |
23.72% |
16.63% |
142.64 |
|
| £10-15K |
19.18% |
16.58% |
115.69 |
|
| £15-20K |
13.08% |
13.58% |
96.27 |
|
| £20-25K |
8.57% |
10.39% |
82.44 |
|
| £25-30K |
5.63% |
7.77% |
72.38 |
|
| £30-35K |
3.76% |
5.79% |
64.87 |
|
| £35-40K |
2.56% |
4.33% |
59.11 |
|
| £40-45K |
1.78% |
3.27% |
54.60 |
|
| £45-50K |
1.27% |
2.48% |
50.98 |
|
| £50-55K |
0.91% |
1.90% |
48.03 |
|
| £55-60K |
0.67% |
1.47% |
45.60 |
|
| £60-65K |
0.50% |
1.15% |
43.57 |
|
| £65-70K |
0.38% |
0.91% |
41.85 |
|
| £70-75K |
0.29% |
0.72% |
40.39 |
|
| £75-80K |
0.22% |
0.57% |
39.14 |
|
| £80-85K |
0.18% |
0.46% |
38.06 |
|
| £85-90K |
0.14% |
0.37% |
37.14 |
|
| £90-95K |
0.11% |
0.31% |
36.33 |
|
| £95-100K |
0.09% |
0.25% |
35.63 |
|
| £100K + |
0.45% |
1.34% |
33.52 |
|
|
|

|


|
1992-1997
|
1997-2001
|
|
|
|
| Con |
-12.91% |
| Lab |
9.69% |
| LD |
2.28% |
|
| Con |
0.76% |
| Lab |
-3.32% |
| LD |
2.95% |
|
|
 |
John Heppell
Labour hold
|
| Con |
 |
7,210 |
24.25% |
| Lab |
 |
17,530 |
58.96% |
| LD |
 |
3,874 |
13.03% |
| Oth |
 |
1,117 |
3.76% |
| Maj |
 |
10,320 |
34.71% |
| Turn |
 |
29,731 |
45.50% |
|
|
 |
John Heppell
Labour hold
|
| C |
Richard Allan |
7,210 |
24.25% |
| LD |
Tim Ball |
3,874 |
13.03% |
| L |
John Heppell |
17,530 |
58.96% |
| SA |
Pete Radcliff |
1,117 |
3.76% |
|
Candidates representing 4 parties stood for election to this seat.
|
|
 |
John Heppell
Labour
|
| Con |
 |
9,336 |
23.49% |
| Lab |
 |
24,755 |
62.29% |
| LD |
 |
4,008 |
10.08% |
| Ref |
 |
1,645 |
4.14% |
| Oth |
|
0 |
0.00% |
| Maj |
 |
15,419 |
38.80% |
| Turn |
 |
39,744 |
60.60% |
|
|
 |
|
Labour
|
| Con |
 |
17,346 |
36.40% |
| Lab |
 |
25,026 |
52.60% |
| LD |
 |
3,695 |
7.80% |
| Oth |
 |
1,548 |
3.30% |
| Maj |
 |
7,680 |
16.10% |
| Turn |
 |
47,615 |
69.55% |
|
|
 |
|

|

