|
Nottingham North
Labour hold

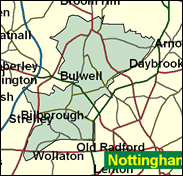
By far the most working class seat in Nottingham, and indeed one of the twenty most non-manual in the country (a disproportionate number of these are in the English Midlands), North brings together the council estates and older terraces of the unfashionable side of the city, which was once known for being dominated by Boots the chemist, Raleigh bicycles and Players cigarettes, along with lace making and other textiles, with their high proportion of female employment. Now Nottingham has diversified as the old manufacturing industries have disappeared, but it remains known for its independence, feisty working class culture and good value for money; it is consistently voted the best city in the country in which to be a student, of which there are many thousands. Although lost like all the Nottingham seats in the abysmal Labour year of 1983, Graham Allen now has a safe majority of nearly 19,000.

Graham Allen, elected here in 1992, one of the tallest MPs, and one of a number of de-moustachioed Labour ones, (in Blairite facially-correct mode), is number four in the Whips' Office, to the silence of which he is well-suited as the owner of a rather flat Nottingham-accented brogue. A party staffer to his finger tips, he worked previously at Labour's headquarters or at the GLC. Born 1953 and educated at Forest Fields Grammar School, City of London Polytechnic and Leeds University, he came in originally with a taste for institutional tinkering in the direction of the "separation of powers", but as a Whip has now settled for their more realistic "fusion."
 |
| Wealthy Achievers, Suburban Areas |
2.49% |
14.99% |
16.61 |
|
| Affluent Greys, Rural Communities |
0.00% |
2.13% |
0.00 |
|
| Prosperous Pensioners, Retirement Areas |
1.31% |
2.49% |
52.69 |
|
| Affluent Executives, Family Areas |
3.38% |
4.43% |
76.30 |
|
| Well-Off Workers, Family Areas |
5.85% |
7.27% |
80.48 |
|
| Affluent Urbanites, Town & City Areas |
0.16% |
2.56% |
6.31 |
|
| Prosperous Professionals, Metropolitan Areas |
0.00% |
2.04% |
0.00 |
|
| Better-Off Executives, Inner City Areas |
0.20% |
3.94% |
4.97 |
|
| Comfortable Middle Agers, Mature Home Owning Areas |
2.86% |
13.04% |
21.90 |
|
| Skilled Workers, Home Owning Areas |
13.65% |
12.70% |
107.44 |
|
| New Home Owners, Mature Communities |
16.06% |
8.14% |
197.20 |
|
| White Collar Workers, Better-Off Multi Ethnic Areas |
0.00% |
4.02% |
0.00 |
|
| Older People, Less Prosperous Areas |
7.75% |
3.19% |
243.15 |
|
| Council Estate Residents, Better-Off Homes |
28.41% |
11.31% |
251.13 |
|
| Council Estate Residents, High Unemployment |
3.17% |
3.06% |
103.42 |
|
| Council Estate Residents, Greatest Hardship |
14.73% |
2.52% |
584.90 |
|
| People in Multi-Ethnic, Low-Income Areas |
0.00% |
2.10% |
0.00 |
|
| Unclassified |
0.00% |
0.06% |
0.00 |
|
|
 |
 |
 |
| £0-5K |
18.34% |
9.41% |
194.81 |
|
| £5-10K |
26.16% |
16.63% |
157.29 |
|
| £10-15K |
20.30% |
16.58% |
122.42 |
|
| £15-20K |
13.11% |
13.58% |
96.49 |
|
| £20-25K |
8.06% |
10.39% |
77.55 |
|
| £25-30K |
4.94% |
7.77% |
63.51 |
|
| £30-35K |
3.06% |
5.79% |
52.90 |
|
| £35-40K |
1.94% |
4.33% |
44.72 |
|
| £40-45K |
1.25% |
3.27% |
38.31 |
|
| £45-50K |
0.82% |
2.48% |
33.21 |
|
| £50-55K |
0.55% |
1.90% |
29.09 |
|
| £55-60K |
0.38% |
1.47% |
25.73 |
|
| £60-65K |
0.26% |
1.15% |
22.96 |
|
| £65-70K |
0.19% |
0.91% |
20.65 |
|
| £70-75K |
0.13% |
0.72% |
18.70 |
|
| £75-80K |
0.10% |
0.57% |
17.05 |
|
| £80-85K |
0.07% |
0.46% |
15.64 |
|
| £85-90K |
0.05% |
0.37% |
14.43 |
|
| £90-95K |
0.04% |
0.31% |
13.38 |
|
| £95-100K |
0.03% |
0.25% |
12.46 |
|
| £100K + |
0.12% |
1.34% |
8.99 |
|
|
|

|


|
1992-1997
|
1997-2001
|
|
|
|
| Con |
-14.81% |
| Lab |
10.01% |
| LD |
-0.63% |
|
| Con |
3.56% |
| Lab |
-1.03% |
| LD |
2.42% |
|
|
 |
Graham Allen
Labour hold
|
| Con |
 |
7,152 |
23.85% |
| Lab |
 |
19,392 |
64.68% |
| LD |
 |
3,117 |
10.40% |
| Oth |
 |
321 |
1.07% |
| Maj |
 |
12,240 |
40.82% |
| Turn |
 |
29,982 |
46.64% |
|
|
 |
Graham Allen
Labour hold
|
| L |
Graham Allen |
19,392 |
64.68% |
| SL |
Andrew Botham |
321 |
1.07% |
| LD |
Rob Lee |
3,117 |
10.40% |
| C |
Martin Wright |
7,152 |
23.85% |
|
Candidates representing 4 parties stood for election to this seat.
|
|
 |
Graham Allen
Labour
|
| Con |
 |
8,402 |
20.29% |
| Lab |
 |
27,203 |
65.71% |
| LD |
 |
3,301 |
7.97% |
| Ref |
 |
1,858 |
4.49% |
| Oth |
 |
637 |
1.54% |
| Maj |
 |
18,801 |
45.41% |
| Turn |
 |
41,401 |
63.02% |
|
|
 |
|
Labour
|
| Con |
 |
18,309 |
35.10% |
| Lab |
 |
29,052 |
55.70% |
| LD |
 |
4,477 |
8.60% |
| Oth |
 |
274 |
0.50% |
| Maj |
 |
10,743 |
20.60% |
| Turn |
 |
52,112 |
74.23% |
|
|
 |
|

|

