|
Nottingham South
Labour hold

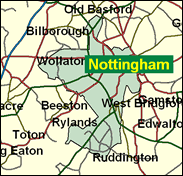
Nottingham South consists of at least three very different neighbourhoods: the first is the city centre, including the working class Meadows area between the hilly "downtown" and the river Trent, the heavily non-white Lenton ward to the west of the centre near the old Raleigh cycle works, and, anomalously, the old west end of the city, the Park estate, laid out in its crescents and circuses though largely converted for example for residential homes for nurses in the nearby hospitals. Second is to be found Nottingham's western suburbs, towards the university, which includes the most favoured residential area within the boundaries, Wollaton. Finally, there is the area south of the river, principally the huge council estate of Clifton. Although the Conservatives won Wollaton ward in the May 2000 local elections, the others are fairly solidly Labour, and the overall pattern indicates another easy win for Alan Simpson.

Alan Simpson, MP here since 1992, is one of the hardest leftwing critics of the Blair government, having previously been the eighth most rebellious backbencher in Opposition before 1997. Merseyside-born in 1948 and educated at Bootle Grammar School and Nottingham Polytechnic, he worked in the voluntary sector in Nottingham, eventually in racial equality. A leading officer of the Campaign Group, he is a man for all rebellions, from the lone parent benefit cuts in 1997 to air traffic control privatisation in 2000. An intense, sardonic, vegetarian footballer, he predicts that international capitalism will provoke mass migration and war, and has correspondingly low expectations of ministerial advancement.
 |
| Wealthy Achievers, Suburban Areas |
13.89% |
14.99% |
92.67 |
|
| Affluent Greys, Rural Communities |
0.00% |
2.13% |
0.00 |
|
| Prosperous Pensioners, Retirement Areas |
1.24% |
2.49% |
49.70 |
|
| Affluent Executives, Family Areas |
2.82% |
4.43% |
63.69 |
|
| Well-Off Workers, Family Areas |
2.62% |
7.27% |
35.99 |
|
| Affluent Urbanites, Town & City Areas |
2.12% |
2.56% |
82.55 |
|
| Prosperous Professionals, Metropolitan Areas |
1.04% |
2.04% |
50.88 |
|
| Better-Off Executives, Inner City Areas |
18.84% |
3.94% |
477.64 |
|
| Comfortable Middle Agers, Mature Home Owning Areas |
6.13% |
13.04% |
47.04 |
|
| Skilled Workers, Home Owning Areas |
4.11% |
12.70% |
32.35 |
|
| New Home Owners, Mature Communities |
15.27% |
8.14% |
187.49 |
|
| White Collar Workers, Better-Off Multi Ethnic Areas |
2.84% |
4.02% |
70.52 |
|
| Older People, Less Prosperous Areas |
4.83% |
3.19% |
151.74 |
|
| Council Estate Residents, Better-Off Homes |
13.88% |
11.31% |
122.68 |
|
| Council Estate Residents, High Unemployment |
7.21% |
3.06% |
235.37 |
|
| Council Estate Residents, Greatest Hardship |
1.16% |
2.52% |
46.11 |
|
| People in Multi-Ethnic, Low-Income Areas |
1.69% |
2.10% |
80.25 |
|
| Unclassified |
0.33% |
0.06% |
529.56 |
|
|
 |
 |
 |
| £0-5K |
15.91% |
9.41% |
168.98 |
|
| £5-10K |
21.90% |
16.63% |
131.67 |
|
| £10-15K |
18.09% |
16.58% |
109.12 |
|
| £15-20K |
12.76% |
13.58% |
93.94 |
|
| £20-25K |
8.69% |
10.39% |
83.59 |
|
| £25-30K |
5.94% |
7.77% |
76.43 |
|
| £30-35K |
4.14% |
5.79% |
71.41 |
|
| £35-40K |
2.94% |
4.33% |
67.85 |
|
| £40-45K |
2.13% |
3.27% |
65.30 |
|
| £45-50K |
1.58% |
2.48% |
63.47 |
|
| £50-55K |
1.18% |
1.90% |
62.16 |
|
| £55-60K |
0.90% |
1.47% |
61.22 |
|
| £60-65K |
0.70% |
1.15% |
60.57 |
|
| £65-70K |
0.54% |
0.91% |
60.12 |
|
| £70-75K |
0.43% |
0.72% |
59.84 |
|
| £75-80K |
0.34% |
0.57% |
59.68 |
|
| £80-85K |
0.28% |
0.46% |
59.61 |
|
| £85-90K |
0.22% |
0.37% |
59.62 |
|
| £90-95K |
0.18% |
0.31% |
59.69 |
|
| £95-100K |
0.15% |
0.25% |
59.81 |
|
| £100K + |
0.83% |
1.34% |
61.56 |
|
|
|

|


|
1992-1997
|
1997-2001
|
|
|
|
| Con |
-14.06% |
| Lab |
7.59% |
| LD |
2.91% |
|
| Con |
-0.53% |
| Lab |
-0.79% |
| LD |
3.65% |
|
|
 |
Alan Simpson
Labour hold
|
| Con |
 |
9,960 |
27.21% |
| Lab |
 |
19,949 |
54.50% |
| LD |
 |
6,064 |
16.57% |
| Oth |
 |
632 |
1.73% |
| Maj |
 |
9,989 |
27.29% |
| Turn |
 |
36,605 |
50.11% |
|
|
 |
Alan Simpson
Labour hold
|
| UK |
David Bartrop |
632 |
1.73% |
| C |
Wendy Manning |
9,960 |
27.21% |
| LD |
Kevin Mulloy |
6,064 |
16.57% |
| L |
Alan Simpson |
19,949 |
54.50% |
|
Candidates representing 4 parties stood for election to this seat.
|
|
 |
Alan Simpson
Labour
|
| Con |
 |
13,461 |
27.74% |
| Lab |
 |
26,825 |
55.29% |
| LD |
 |
6,265 |
12.91% |
| Ref |
 |
1,523 |
3.14% |
| Oth |
 |
446 |
0.92% |
| Maj |
 |
13,364 |
27.54% |
| Turn |
 |
48,520 |
67.00% |
|
|
 |
|
Labour
|
| Con |
 |
22,590 |
41.80% |
| Lab |
 |
25,771 |
47.70% |
| LD |
 |
5,408 |
10.00% |
| Oth |
 |
263 |
0.50% |
| Maj |
 |
3,181 |
5.90% |
| Turn |
 |
54,032 |
74.59% |
|
|
 |
|

|

