|
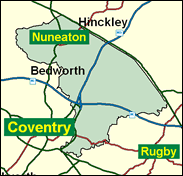
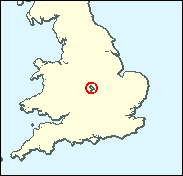
Nuneaton
Labour hold

Like many seats, the industrial Warwickshire town of Nuneaton elected a Conservative in 1983 and 1987 in that most Thatcherite of decades; previously the blue party had not been victorious since 1931, a true landslide year. The picture is that Labour loses only when the party is riven, seeen as extreme, and generally in terrible shape. In a year when they are united, advancing, confident and full of ideas as in 1997 they win, usually easily. At the moment 2001 looks rather like 1997, at least more than it resembles 1931 or 1983.

Bill Olner, one of the dwindling band of Labour proletarians, was elected here in 1992 after 35 years as a machinist at Rolls Royce in Coventry. Born locally in 1942 and educated at Atherstone Secondary Modern and North Warwickshire Technical College, he sat on Nuneaton Council for 21 years and ran it for five, and is predictably locally-focused. A Commons doughnutter in Opposition, seated behind Tony Blair at question time so as to be in the TV frame despite efforts by the Whips to replace him by more photogenic women, he has post-1997 been displaced anyway by the hordes of ministerial parliamentary private secretaries.
 |
| Wealthy Achievers, Suburban Areas |
11.87% |
14.99% |
79.20 |
|
| Affluent Greys, Rural Communities |
0.09% |
2.13% |
4.01 |
|
| Prosperous Pensioners, Retirement Areas |
0.22% |
2.49% |
8.87 |
|
| Affluent Executives, Family Areas |
13.86% |
4.43% |
313.19 |
|
| Well-Off Workers, Family Areas |
12.89% |
7.27% |
177.21 |
|
| Affluent Urbanites, Town & City Areas |
0.00% |
2.56% |
0.00 |
|
| Prosperous Professionals, Metropolitan Areas |
0.00% |
2.04% |
0.00 |
|
| Better-Off Executives, Inner City Areas |
0.16% |
3.94% |
3.94 |
|
| Comfortable Middle Agers, Mature Home Owning Areas |
7.89% |
13.04% |
60.53 |
|
| Skilled Workers, Home Owning Areas |
23.50% |
12.70% |
184.97 |
|
| New Home Owners, Mature Communities |
7.89% |
8.14% |
96.87 |
|
| White Collar Workers, Better-Off Multi Ethnic Areas |
0.00% |
4.02% |
0.00 |
|
| Older People, Less Prosperous Areas |
4.68% |
3.19% |
146.99 |
|
| Council Estate Residents, Better-Off Homes |
12.12% |
11.31% |
107.18 |
|
| Council Estate Residents, High Unemployment |
1.21% |
3.06% |
39.60 |
|
| Council Estate Residents, Greatest Hardship |
3.09% |
2.52% |
122.83 |
|
| People in Multi-Ethnic, Low-Income Areas |
0.53% |
2.10% |
25.07 |
|
| Unclassified |
0.00% |
0.06% |
0.00 |
|
|
 |
 |
 |
| £0-5K |
9.97% |
9.41% |
105.92 |
|
| £5-10K |
17.47% |
16.63% |
105.02 |
|
| £10-15K |
17.26% |
16.58% |
104.09 |
|
| £15-20K |
14.00% |
13.58% |
103.10 |
|
| £20-25K |
10.58% |
10.39% |
101.77 |
|
| £25-30K |
7.78% |
7.77% |
100.09 |
|
| £30-35K |
5.68% |
5.79% |
98.13 |
|
| £35-40K |
4.16% |
4.33% |
96.00 |
|
| £40-45K |
3.06% |
3.27% |
93.78 |
|
| £45-50K |
2.27% |
2.48% |
91.55 |
|
| £50-55K |
1.70% |
1.90% |
89.35 |
|
| £55-60K |
1.29% |
1.47% |
87.20 |
|
| £60-65K |
0.98% |
1.15% |
85.14 |
|
| £65-70K |
0.75% |
0.91% |
83.17 |
|
| £70-75K |
0.58% |
0.72% |
81.28 |
|
| £75-80K |
0.46% |
0.57% |
79.49 |
|
| £80-85K |
0.36% |
0.46% |
77.78 |
|
| £85-90K |
0.29% |
0.37% |
76.15 |
|
| £90-95K |
0.23% |
0.31% |
74.60 |
|
| £95-100K |
0.18% |
0.25% |
73.13 |
|
| £100K + |
0.87% |
1.34% |
64.93 |
|
|
|

|


|
1992-1997
|
1997-2001
|
|
|
|
| Con |
-12.09% |
| Lab |
10.41% |
| LD |
-2.36% |
|
| Con |
3.82% |
| Lab |
-4.08% |
| LD |
2.29% |
|
|
 |
Bill Olner
Labour hold
|
| Con |
 |
15,042 |
34.73% |
| Lab |
 |
22,577 |
52.13% |
| LD |
 |
4,820 |
11.13% |
| Oth |
 |
873 |
2.02% |
| Maj |
 |
7,535 |
17.40% |
| Turn |
 |
43,312 |
60.07% |
|
|
 |
Bill Olner
Labour hold
|
| LD |
Tony Ferguson |
4,820 |
11.13% |
| UK |
Brian James |
873 |
2.02% |
| C |
Mark Lancaster |
15,042 |
34.73% |
| L |
Bill Olner |
22,577 |
52.13% |
|
Candidates representing 4 parties stood for election to this seat.
|
|
 |
Bill Olner
Labour
|
| Con |
 |
16,540 |
30.91% |
| Lab |
 |
30,080 |
56.21% |
| LD |
 |
4,732 |
8.84% |
| Ref |
 |
1,533 |
2.86% |
| Oth |
 |
628 |
1.17% |
| Maj |
 |
13,540 |
25.30% |
| Turn |
 |
53,513 |
74.29% |
|
|
 |
|
Labour
|
| Con |
 |
25,526 |
43.00% |
| Lab |
 |
27,157 |
45.80% |
| LD |
 |
6,671 |
11.20% |
| Oth |
|
0 |
0.00% |
| Maj |
 |
1,631 |
2.70% |
| Turn |
 |
59,354 |
82.52% |
|
|
 |
|

|

