|
Ochil
Labour hold

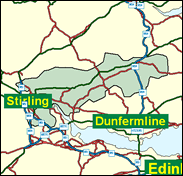
This is one of the SNP's very best chances of a gain from Labour in industrial central Scotland, partly because this seat is the linear successor to the former Stirlingshire East and Clackmannan seat which George Reid held from 1974 to 1979. Reid is still active here, holding MP Martin O'Neill to a lead of just over 4,500 in 1997 and approaching within 1,400 votes of a first past the post seat here in the inaugural May 1999 Scottish Parliament elections. Reid did find a place in that Parliament through the top up system which ensured a greater degree of proportionality, and this time Ochil is being contested by the popular Clackmannan Council's leader Keith Brown, which may well not reduce the pressure on Labour and O'Neill one iota.

Martin O'Neill, Labour's most senior backbench Scottish MP, as chairman of the Trade & Industry Select Committee, was dropped as a frontbencher in 1995 on grounds of age. Burly and affable, he was born 1945 and educated at Trinity Academy, Edinburgh and, after five years as an insurance office clerk, attended Heriot Watt University and became a teacher. His time came in the Kinnock years as the Defence spokesman who braved the minefield involved in coaxing Labour away from unilateralism, and he has proved a hands-on loyalist under a Labour government, managing to deflect blame for major industrial closures of car plants and steelworks away from ministers. In a seat targeted by the SNP, they are running Clackmannanshire Councillor Keith Brown, a local government officer born in 1961 and educated at Dundee University.
 |
| Wealthy Achievers, Suburban Areas |
12.79% |
14.99% |
85.30 |
|
| Affluent Greys, Rural Communities |
0.53% |
2.13% |
25.16 |
|
| Prosperous Pensioners, Retirement Areas |
0.40% |
2.49% |
15.95 |
|
| Affluent Executives, Family Areas |
5.00% |
4.43% |
112.89 |
|
| Well-Off Workers, Family Areas |
11.75% |
7.27% |
161.52 |
|
| Affluent Urbanites, Town & City Areas |
2.34% |
2.56% |
91.08 |
|
| Prosperous Professionals, Metropolitan Areas |
0.21% |
2.04% |
10.40 |
|
| Better-Off Executives, Inner City Areas |
3.49% |
3.94% |
88.44 |
|
| Comfortable Middle Agers, Mature Home Owning Areas |
5.08% |
13.04% |
38.96 |
|
| Skilled Workers, Home Owning Areas |
4.08% |
12.70% |
32.12 |
|
| New Home Owners, Mature Communities |
13.52% |
8.14% |
166.02 |
|
| White Collar Workers, Better-Off Multi Ethnic Areas |
0.14% |
4.02% |
3.38 |
|
| Older People, Less Prosperous Areas |
5.53% |
3.19% |
173.50 |
|
| Council Estate Residents, Better-Off Homes |
23.16% |
11.31% |
204.76 |
|
| Council Estate Residents, High Unemployment |
4.52% |
3.06% |
147.61 |
|
| Council Estate Residents, Greatest Hardship |
7.03% |
2.52% |
279.05 |
|
| People in Multi-Ethnic, Low-Income Areas |
0.00% |
2.10% |
0.00 |
|
| Unclassified |
0.45% |
0.06% |
717.93 |
|
|
 |
 |
 |
| £0-5K |
9.87% |
9.41% |
104.85 |
|
| £5-10K |
17.15% |
16.63% |
103.09 |
|
| £10-15K |
16.93% |
16.58% |
102.11 |
|
| £15-20K |
13.80% |
13.58% |
101.56 |
|
| £20-25K |
10.49% |
10.39% |
100.96 |
|
| £25-30K |
7.78% |
7.77% |
100.12 |
|
| £30-35K |
5.74% |
5.79% |
99.06 |
|
| £35-40K |
4.24% |
4.33% |
97.83 |
|
| £40-45K |
3.15% |
3.27% |
96.51 |
|
| £45-50K |
2.36% |
2.48% |
95.16 |
|
| £50-55K |
1.79% |
1.90% |
93.81 |
|
| £55-60K |
1.36% |
1.47% |
92.50 |
|
| £60-65K |
1.05% |
1.15% |
91.23 |
|
| £65-70K |
0.82% |
0.91% |
90.01 |
|
| £70-75K |
0.64% |
0.72% |
88.86 |
|
| £75-80K |
0.50% |
0.57% |
87.76 |
|
| £80-85K |
0.40% |
0.46% |
86.71 |
|
| £85-90K |
0.32% |
0.37% |
85.72 |
|
| £90-95K |
0.26% |
0.31% |
84.78 |
|
| £95-100K |
0.21% |
0.25% |
83.87 |
|
| £100K + |
1.06% |
1.34% |
78.66 |
|
|
|

|


|
1992-1997
|
1997-2001
|
|
|
|
| Con |
-9.42% |
| Lab |
1.91% |
| LD |
-1.73% |
| SNP |
8.28% |
|
| Con |
-2.58% |
| Lab |
0.33% |
| LD |
4.05% |
| SNP |
-4.20% |
|
|
 |
Martin O'Neill
Labour hold
|
| Con |
 |
4,235 |
12.00% |
| Lab |
 |
16,004 |
45.33% |
| LD |
 |
3,253 |
9.21% |
| SNP |
 |
10,655 |
30.18% |
| Oth |
 |
1,156 |
3.27% |
| Maj |
 |
5,349 |
15.15% |
| Turn |
 |
35,303 |
61.34% |
|
|
 |
Martin O'Neill
Labour hold
|
| MR |
Flash Gordon Approaching |
405 |
1.15% |
| SNP |
Keith Brown |
10,655 |
30.18% |
| C |
Alasdair Campbell |
4,235 |
12.00% |
| LD |
Paul Edie |
3,253 |
9.21% |
| L |
Martin O'Neill |
16,004 |
45.33% |
| SSP |
Pauline Thompson |
751 |
2.13% |
|
Candidates representing 6 parties stood for election to this seat.
|
|
 |
Martin O'Neill
Labour
|
| Con |
 |
6,383 |
14.58% |
| Lab |
 |
19,707 |
45.01% |
| LD |
 |
2,262 |
5.17% |
| SNP |
 |
15,055 |
34.38% |
| Ref |
 |
210 |
0.48% |
| Oth |
 |
169 |
0.39% |
| Maj |
 |
4,652 |
10.62% |
| Turn |
 |
43,786 |
77.40% |
|
|
 |
|
Labour
|
| Con |
 |
10,367 |
24.00% |
| Lab |
 |
18,620 |
43.10% |
| LD |
 |
2,984 |
6.90% |
| SNP |
 |
11,270 |
26.10% |
| Oth |
|
0 |
0.00% |
| Maj |
 |
7,350 |
17.00% |
| Turn |
 |
43,241 |
77.94% |
|
|
 |
|

|

