|
Old Bexley & Sidcup
Conservative hold

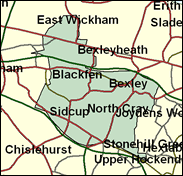
Just for a little longer this is the seat of Sir Edward Heath, MP for the area (named successively Bexley, Sidcup, and as now) for over fifty tears, which makes him the Father of the House. His majority has been slim on a couple of occasions, as in 1966 when he was leader of his party and of Her Majesty's Opposition, when he only won by 2,333. He did a little better in 1997, which saw a still more decisive General Election victory for Labour; but now this seat in suburban Kentish London is even more well drawn for the Conservatives, with a massive 85pc owner occupation rate, the highest proportion anywhere in the capital. After 14 terms, Sir Edward will depart voluntarily in his mid eighties, and should be able to pass the seat on to another member of his party.

Sir Edward Heath's successor here is Derek Conway, MP for Shrewsbury for 14 years until 1997 and one of a score of Conservative casualties of that year seeking their way back in 2001. Like Ted Heath a meritocrat of humble origins, he was born in Newcastle-on-Tyne in 1953, and educated at secondary modern school, technical college and polytechnic. He fought his way up via politics, contesting his first parliamentary seat (Durham) aged 21 in 1974, and then led the Tories on Tyne & Wear County Council. A Eurosceptic-turned-Whip under John Major, he has been active in the TA and worked variously for charities, ranging from Action Research for the Crippled Child to the Cats Protection League, of which he is currently chief executive. As a Whip he was involved in briefing John Major before question time.
 |
| Wealthy Achievers, Suburban Areas |
15.65% |
14.99% |
104.39 |
|
| Affluent Greys, Rural Communities |
0.00% |
2.13% |
0.00 |
|
| Prosperous Pensioners, Retirement Areas |
3.91% |
2.49% |
157.34 |
|
| Affluent Executives, Family Areas |
0.63% |
4.43% |
14.33 |
|
| Well-Off Workers, Family Areas |
4.52% |
7.27% |
62.14 |
|
| Affluent Urbanites, Town & City Areas |
2.89% |
2.56% |
112.71 |
|
| Prosperous Professionals, Metropolitan Areas |
1.92% |
2.04% |
93.85 |
|
| Better-Off Executives, Inner City Areas |
0.30% |
3.94% |
7.66 |
|
| Comfortable Middle Agers, Mature Home Owning Areas |
41.18% |
13.04% |
315.80 |
|
| Skilled Workers, Home Owning Areas |
21.54% |
12.70% |
169.54 |
|
| New Home Owners, Mature Communities |
3.18% |
8.14% |
39.04 |
|
| White Collar Workers, Better-Off Multi Ethnic Areas |
0.93% |
4.02% |
23.14 |
|
| Older People, Less Prosperous Areas |
0.48% |
3.19% |
14.98 |
|
| Council Estate Residents, Better-Off Homes |
2.45% |
11.31% |
21.70 |
|
| Council Estate Residents, High Unemployment |
0.06% |
3.06% |
1.93 |
|
| Council Estate Residents, Greatest Hardship |
0.36% |
2.52% |
14.30 |
|
| People in Multi-Ethnic, Low-Income Areas |
0.00% |
2.10% |
0.00 |
|
| Unclassified |
0.00% |
0.06% |
0.00 |
|
|
 |
 |
 |
| £0-5K |
5.49% |
9.41% |
58.36 |
|
| £5-10K |
11.46% |
16.63% |
68.91 |
|
| £10-15K |
13.65% |
16.58% |
82.31 |
|
| £15-20K |
12.98% |
13.58% |
95.54 |
|
| £20-25K |
11.17% |
10.39% |
107.52 |
|
| £25-30K |
9.17% |
7.77% |
117.92 |
|
| £30-35K |
7.34% |
5.79% |
126.75 |
|
| £35-40K |
5.81% |
4.33% |
134.13 |
|
| £40-45K |
4.58% |
3.27% |
140.22 |
|
| £45-50K |
3.60% |
2.48% |
145.20 |
|
| £50-55K |
2.84% |
1.90% |
149.24 |
|
| £55-60K |
2.25% |
1.47% |
152.49 |
|
| £60-65K |
1.79% |
1.15% |
155.08 |
|
| £65-70K |
1.42% |
0.91% |
157.11 |
|
| £70-75K |
1.14% |
0.72% |
158.68 |
|
| £75-80K |
0.92% |
0.57% |
159.86 |
|
| £80-85K |
0.74% |
0.46% |
160.72 |
|
| £85-90K |
0.60% |
0.37% |
161.32 |
|
| £90-95K |
0.49% |
0.31% |
161.69 |
|
| £95-100K |
0.40% |
0.25% |
161.87 |
|
| £100K + |
2.14% |
1.34% |
159.03 |
|
|
|

|


|
1992-1997
|
1997-2001
|
|
|
|
| Con |
-14.25% |
| Lab |
14.00% |
| LD |
-4.78% |
|
| Con |
3.36% |
| Lab |
2.36% |
| LD |
-2.37% |
|
|
 |
Derek Conway
Conservative hold
|
| Con |
 |
19,130 |
45.40% |
| Lab |
 |
15,785 |
37.46% |
| LD |
 |
5,792 |
13.75% |
| Oth |
 |
1,426 |
3.38% |
| Maj |
 |
3,345 |
7.94% |
| Turn |
 |
42,133 |
62.11% |
|
|
 |
Derek Conway
Conservative hold
|
| C |
Derek Conway |
19,130 |
45.40% |
| UK |
Janice Cronin |
1,426 |
3.38% |
| L |
Jim Dickson |
15,785 |
37.46% |
| LD |
Belinda Ford |
5,792 |
13.75% |
|
Candidates representing 4 parties stood for election to this seat.
|
|
 |
Edward Heath
Conservative
|
| Con |
 |
21,608 |
42.05% |
| Lab |
 |
18,039 |
35.10% |
| LD |
 |
8,284 |
16.12% |
| Ref |
 |
2,457 |
4.78% |
| Oth |
 |
1,003 |
1.95% |
| Maj |
 |
3,569 |
6.94% |
| Turn |
 |
51,391 |
75.53% |
|
|
 |
|
Conservative
|
| Con |
 |
31,340 |
56.30% |
| Lab |
 |
11,768 |
21.10% |
| LD |
 |
11,642 |
20.90% |
| Oth |
 |
936 |
1.70% |
| Maj |
 |
19,572 |
35.10% |
| Turn |
 |
55,686 |
80.85% |
|
|
 |
|

|

