|
Oldham East & Saddleworth
Labour hold

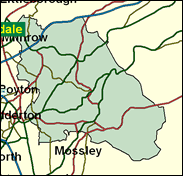
Labour versus Liberal Democrat marginals are very rare. At present, the only serious chance the Liberal Democrats have of seizing a seat from the governing party in England lies in Oldham East and Saddleworth, which Phil Woolas took during the General Election day landslide of 1997 from the 1995 byelection victor Chris Davies. Davies was elected as top of the North West England regional list of Members of the European Parliament in 1999. In these elections, by the way, the Lib Dem slate obtained the most votes in Oldham East and Saddleworth, one of only three seats in the country where this happened, and the only one not currently held by a Lib Dem. (The facts contained in the last two sentences may be related). It is left to a new candidate, Howard Sykes, to try very hard to reverse this in yet another re-run in 2001, but this would depend on the destruction of the third element in this heady battle: the Conservative share of the vote, which was still at 20pc - over 10,000 - in 1997; it should be remembered that the late Geoffrey Dickens had held this seat and its predecessor Littleborough and Saddleworth from 1983 to 1995. This is still a largely attractive Pennine seat, and in the long run may become a three way marginal once more. The troubled predominantly Asian Muslim Glodwick neighbourhood, which was rather sensationally declared a no-go area for white people in the press in late April and became the centre of race riots in late May, is centred in St Mary's ward, like the division as a whole in this respect only, has proved a very competitive Labour - Lib Dem marginal contest in recent years.

Phil Woolas, PPS to Transport Minister Lord Macdonald, was elected here for Labour in 1997 after failing to take the precursor seat in a dirty Mandelson-run byelection campaign which saw the victory of a Liberal Democrat candidate smeared by Labour as soft on drugs and higher taxes. An ex-GMB staffer and TV producer, born 1959 and educated at Nelson Grammar School and Manchester University, with ambition-driven flexibility he has endorsed sundry orthodoxies and currently has a personal interest in resisting any national Lib-Labbery. Once pro Troops Out, he now votes against attempts to change the Oath to enable the Sinn Fein MPs to take their seats. The Liberal Democrats hope to retake the seat with the seasoned local campaigner and councillor, Howard Sykes, chief executive of the Association of Liberal Democrat councillors, born 1963 and educated at Royton & Crompton Comprehensive. For Liberals, localness is all, as he shows in mocking Tory candidate Craig Heeley, who is trying to restore Conservative fortunes destroyed at the earlier by-election from a domicile in Gloucestershire where he rides to the Beaufort Hunt.
 |
| Wealthy Achievers, Suburban Areas |
12.23% |
14.99% |
81.57 |
|
| Affluent Greys, Rural Communities |
0.00% |
2.13% |
0.00 |
|
| Prosperous Pensioners, Retirement Areas |
0.17% |
2.49% |
6.97 |
|
| Affluent Executives, Family Areas |
3.41% |
4.43% |
77.16 |
|
| Well-Off Workers, Family Areas |
15.86% |
7.27% |
218.09 |
|
| Affluent Urbanites, Town & City Areas |
0.00% |
2.56% |
0.08 |
|
| Prosperous Professionals, Metropolitan Areas |
0.40% |
2.04% |
19.60 |
|
| Better-Off Executives, Inner City Areas |
0.13% |
3.94% |
3.23 |
|
| Comfortable Middle Agers, Mature Home Owning Areas |
8.72% |
13.04% |
66.86 |
|
| Skilled Workers, Home Owning Areas |
27.81% |
12.70% |
218.92 |
|
| New Home Owners, Mature Communities |
3.62% |
8.14% |
44.50 |
|
| White Collar Workers, Better-Off Multi Ethnic Areas |
0.44% |
4.02% |
11.02 |
|
| Older People, Less Prosperous Areas |
5.68% |
3.19% |
178.23 |
|
| Council Estate Residents, Better-Off Homes |
11.55% |
11.31% |
102.10 |
|
| Council Estate Residents, High Unemployment |
1.53% |
3.06% |
49.94 |
|
| Council Estate Residents, Greatest Hardship |
6.04% |
2.52% |
239.69 |
|
| People in Multi-Ethnic, Low-Income Areas |
2.40% |
2.10% |
114.42 |
|
| Unclassified |
0.00% |
0.06% |
0.00 |
|
|
 |
 |
 |
| £0-5K |
9.92% |
9.41% |
105.43 |
|
| £5-10K |
17.59% |
16.63% |
105.77 |
|
| £10-15K |
17.48% |
16.58% |
105.40 |
|
| £15-20K |
14.12% |
13.58% |
103.92 |
|
| £20-25K |
10.57% |
10.39% |
101.74 |
|
| £25-30K |
7.71% |
7.77% |
99.23 |
|
| £30-35K |
5.60% |
5.79% |
96.61 |
|
| £35-40K |
4.07% |
4.33% |
94.00 |
|
| £40-45K |
2.99% |
3.27% |
91.46 |
|
| £45-50K |
2.21% |
2.48% |
89.03 |
|
| £50-55K |
1.65% |
1.90% |
86.73 |
|
| £55-60K |
1.25% |
1.47% |
84.56 |
|
| £60-65K |
0.95% |
1.15% |
82.52 |
|
| £65-70K |
0.73% |
0.91% |
80.61 |
|
| £70-75K |
0.57% |
0.72% |
78.81 |
|
| £75-80K |
0.44% |
0.57% |
77.12 |
|
| £80-85K |
0.35% |
0.46% |
75.54 |
|
| £85-90K |
0.28% |
0.37% |
74.05 |
|
| £90-95K |
0.22% |
0.31% |
72.65 |
|
| £95-100K |
0.18% |
0.25% |
71.33 |
|
| £100K + |
0.87% |
1.34% |
64.40 |
|
|
|

|


|
1992-1997
|
1997-2001
|
|
|
|
| Con |
-15.69% |
| Lab |
11.47% |
| LD |
1.01% |
|
| Con |
-3.63% |
| Lab |
-3.06% |
| LD |
-2.80% |
|
|
 |
Phil Woolas
Labour hold
|
| Con |
 |
7,304 |
16.08% |
| Lab |
 |
17,537 |
38.61% |
| LD |
 |
14,811 |
32.61% |
| Oth |
 |
5,768 |
12.70% |
| Maj |
 |
2,726 |
6.00% |
| Turn |
 |
45,420 |
60.96% |
|
|
 |
Phil Woolas
Labour hold
|
| C |
Craig Heeley |
7,304 |
16.08% |
| UK |
Barbara Little |
677 |
1.49% |
| LD |
Howard Sykes |
14,811 |
32.61% |
| BNP |
Michael Treacy |
5,091 |
11.21% |
| L |
Phil Woolas |
17,537 |
38.61% |
|
Candidates representing 5 parties stood for election to this seat.
|
|
 |
Phil Woolas
Labour gain
|
| Con |
 |
10,666 |
19.71% |
| Lab |
 |
22,546 |
41.67% |
| LD |
 |
19,157 |
35.41% |
| Ref |
 |
1,116 |
2.06% |
| Oth |
 |
616 |
1.14% |
| Maj |
 |
3,389 |
6.26% |
| Turn |
 |
54,101 |
73.92% |
|
|
 |
|
Conservative
|
| Con |
 |
20,271 |
35.40% |
| Lab |
 |
17,300 |
30.20% |
| LD |
 |
19,712 |
34.40% |
| Oth |
|
0 |
0.00% |
| Maj |
 |
559 |
1.00% |
| Turn |
 |
57,283 |
77.35% |
|
|
 |
|

|

